
dsh-usage-panel
已验证 · 实测可装 AlfredChaos
功能简介
DeepSeek Harness 消耗统计插件:设置页 Token 用量 KPI、半年活跃热力图、按模型堆叠柱状图与模型环形图(dsh-plugin)
可用 — 实测通过,早期项目
DeepSeek Harness 消耗统计插件:设置页 Token 用量 KPI、半年活跃热力图、按模型堆叠柱状图与模型环形图(dsh-plugin) 实测能干净安装、正常启动。早期项目,但功能可用。
「已验证」表示我们的自动化 CI 在干净 profile 里实际执行了 dsh plugin add 并启动成功——仅此而已。功能描述与版本兼容性均为作者声明。这不是安全审计,也不代表对第三方代码的背书。
README
dsh-usage-panel
Token usage statistics for DeepSeek Harness, shown as a page under Settings → Usage in the web GUI. The plugin aggregates persisted session logs (incrementally, via the session-projection mechanism) and never writes anything back.
简体中文 · 





What it shows
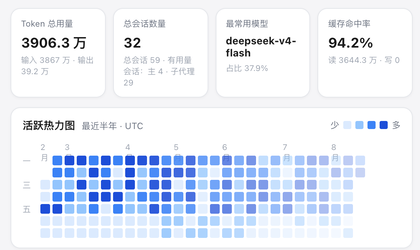
- Cumulative totals (all time) — billed input / output tokens, session count (with the grand total of session records and the main/subagent usage split beneath it), and the most-used model with its share.
- Cache hit rate —
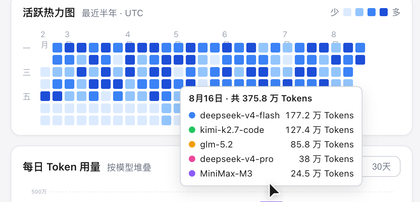
cache read ÷ (uncached input + cache read + cache write), with the read/write magnitudes. - Activity heatmap — the last six months in a GitHub-contribution layout (weeks as columns, weekdays as rows). Days are colored by quartile over non-zero usage.
- Daily stacked bars — per-model token usage, switchable between the last 7, 14, or 30 days.
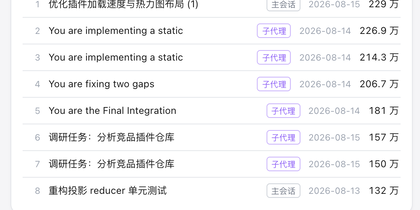
- Top sessions — the 10 most token-hungry sessions with their folded titles, each tagged main or subagent by delegation depth.
- Providers — per-provider token totals as horizontal bars (shown when more than one provider route is in use).
- Model donut — all-time share per model, with the top 5 listed beside it; each row carries a per-model cache hit rate column, color-coded to its segment.
- Export — full JSON, daily CSV and per-model CSV (formula-injection guarded, RFC 4180, UTF-8 BOM).
Hovering a bar, heatmap cell, or donut segment shows the exact breakdown:
| Bar tooltip | Overview (KPI + heatmap) | Sessions & providers |
|---|---|---|
 |
 |
 |
Install
The plugin ships as a bundle: dsh plugin add appends it to the profile's bundle list, and the patch row activates the host half.
# from npm (recommended)
dsh plugin --profile web add dsh-usage-panel

# or from GitHub
dsh plugin --profile web add github:AlfredChaos/dsh-usage-panel

# or from a local checkout
dsh plugin --profile web add ./dsh-usage-panel
Restart dsh --profile web and open Settings → Usage. The npm package ships prebuilt JavaScript under lib/ with no install scripts; GitHub installs need no pnpm build allowance either, because the same files are committed to the repository. To remove it:
dsh plugin --profile web remove dsh-usage-panel
Where the numbers come from
The host half aggregates persisted session logs:
- Primary path (incremental): a session projection (registered through
ctx.sessionProjections,stateVersion-checked) folds every committed event into four disjoint buckets — uncached input, output, cache read, cache write — plus per-model, per-provider and per-day (UTC) maps. Checkpoints are durable, so restarts and keep-warm passes cost almost no replay. - Fallback path (full rescan): when the projection services are unavailable, the same reducer replays every session log through the read-only
sessionQueryservice.
Accounting rules: request/header and request/context events record the model (context base, header override); the step's assistant/message usage replaces streamed provisional usage (a retried same-step message never double-counts); llm/retry events are counted as retries, not tokens; compaction/summary usage is attributed to its own model and reported separately; reasoning tokens are already inside output and are never added again.
Fork dedup: events that precede the last session/end-seed marker (fork/resume/replay seed history) are never counted, so forked sessions do not double-bill their parents' usage.
Timezone declaration: day buckets and exports use UTC calendar days (YYYY-MM-DD); the heatmap subtitle declares the scope ("last 6 months · UTC").
Because nothing is written back, statistics survive restarts and cover sessions from before the plugin was installed.
Loading behavior
The first scan starts as soon as the plugin loads, so the page usually renders straight from cache. A payload is considered fresh for 10 minutes; older ones are returned immediately with a stale flag (the page shows "updating in background") while a rescan refreshes the cache. A keep-warm timer rescans every 10 minutes, and the refresh button always forces a synchronous scan. The browser additionally keeps the last successful payload in localStorage (versioned and structure-validated), so a page refresh renders instantly; a failed refresh keeps the cached numbers and says so instead of faking freshness.
Units
zh interface: 亿 (10⁸) and 万 (10⁴); en interface: K / M / B.
Implementation
Source is TypeScript (strict) in src/, built with esbuild; the lib/ outputs are committed so installs need no build step.
| File | Role |
|---|---|
src/host/index.ts → lib/index.js |
Host half (Cordis plugin): projection registration, aggregation, cached RPC with warm-up, fail-soft fallback |
src/host/projection.ts |
Pure per-session projection reducer (four buckets, fork dedup, retry/compaction semantics, UTC days) |
src/host/aggregate.ts |
Cross-session merge → overview payload |
src/client/* → lib/client.js |
Client half (./client export, __ModuleLoader__ bundle): settings-page UI in TSX, --dsw-* tokens, zh/en i18n |
src/shared/contract.ts |
Host↔client wire contract (single source of truth) |
cordis.patch.yml |
Bundle patch: inserts the usage-stats row into the profile composition |
The host serves an overview endpoint through ctx.connection.rpc.handle('/usage-stats', …, { authority: 'loopback' }); the browser calls it via rpc.call('/usage-stats', 'overview', …). The overview carries coverage (session-record totals and the main/subagent usage split, shown beneath the sessions KPI), topSessions, providers, plus the v0.1.0-shaped days / totals / byModel / allTime. Developed against DeepSeek Harness 0.1.0-rc.6. Tests run on the Node built-in test runner (npm test); CI runs typecheck + build + test + the pack gate.
License
安装
装一次目录插件,之后本站所有插件都能让 DeepSeek Harness 自动找、自动装:
dsh plugin add dshbase-catalog然后对 agent 说「帮我装 dsh-usage-panel」,它会在目录里找到并自动安装。文档:dshbase-catalog · 已验证场景包。
该插件是 GitHub 源码(未发 npm)——直接从仓库装:
Web profile:
dsh plugin --profile web add github:AlfredChaos/dsh-usage-panelHeadless(CLI)profile:
dsh plugin --profile headless add github:AlfredChaos/dsh-usage-panel实测报告
验证通过:从 GitHub 源码完成 L1 安装 + L2 加载 + L3 运行(dsh 0.1.0-rc.6)。
分享徽章
把这枚徽章粘进 README——它会链回本页,实测状态变化时自动更新:

[](https://dshbase.com/zh/plugins/dsh-usage-panel/)<a href="https://dshbase.com/zh/plugins/dsh-usage-panel/"><img src="https://dshbase.com/badges/dsh-usage-panel.svg" alt="dshbase 实测可装"></a>