
Plugin directory / Knowledge / dsh-context
dsh-context
Verified · install-tested on dsh bowenliang123
What it does
A DeepSeek Harness plugin for Context insight panel — a Context tab in the web UI showing what the model's context window is made of and ho…
Recommended — verified working and popular
A DeepSeek Harness plugin for Context insight panel — a Context tab in the web UI showing what the model's context window is made of and ho… It installs cleanly and boots without issues in our testing. With 1552+ stars it's a community-endorsed, low-risk pick.
“Verified” means our automated CI actually ran dsh plugin add in a clean profile and it booted — nothing more. Feature descriptions and version compatibility are the author’s claims. This is not a security audit and not an endorsement of third-party code.
README
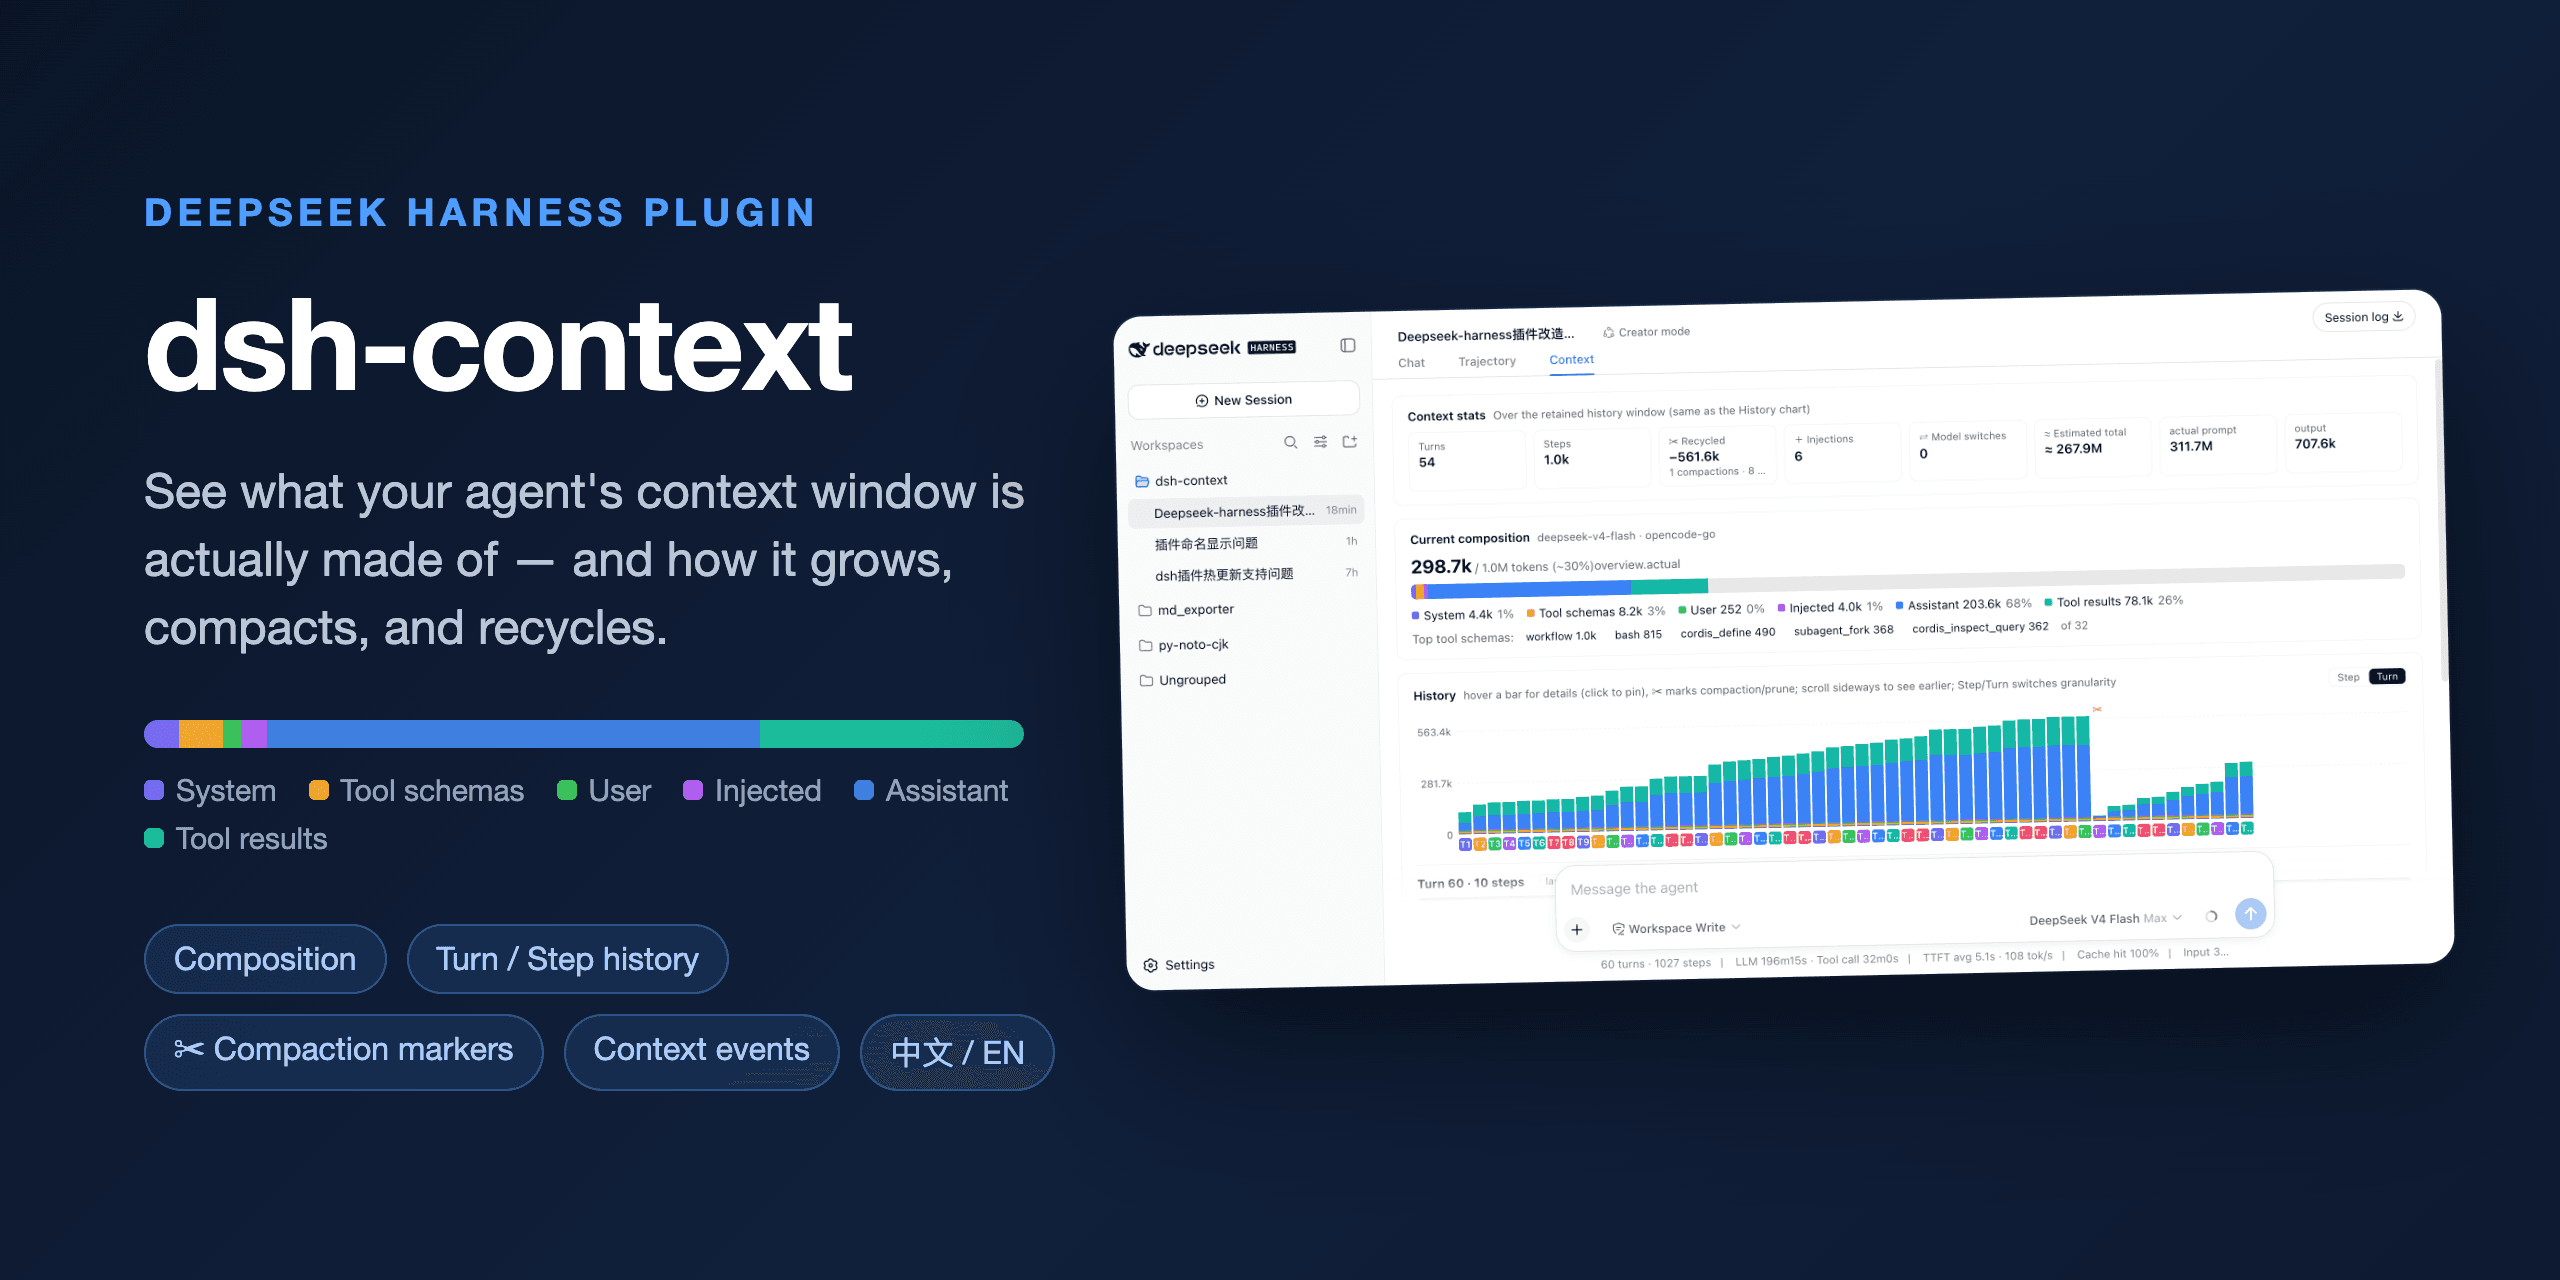
dsh-context


The best DeepSeek Harness plugin for Agent's context insights and management.
dsh-context provides full context lifecycle management features.
- Context Dashboard — the cross-session overview above Settings on the sidebar foot: KPI band with a 7-day token/cost usage chart, activity heatmap, aggregate composition ring, and filterable session cards that jump straight into any session.
- Context tab — an UI context dashboard for DeepSeek Harness's context stats, composition, trend, events, and messages.
- Context panel — the same dashboard as a right-sidebar tab (dsh 0.1.5-rc.1+): pick Context on the sidebar's guide page and the panel opens beside the chat.
/contextcommand — the slash command shows the context model for current context composition and recent context evolution.
Install / Update
Install on DeekSeek Harness web or desktop
Fill dsh-context in the Add plugin wizard's search box, and click Install:
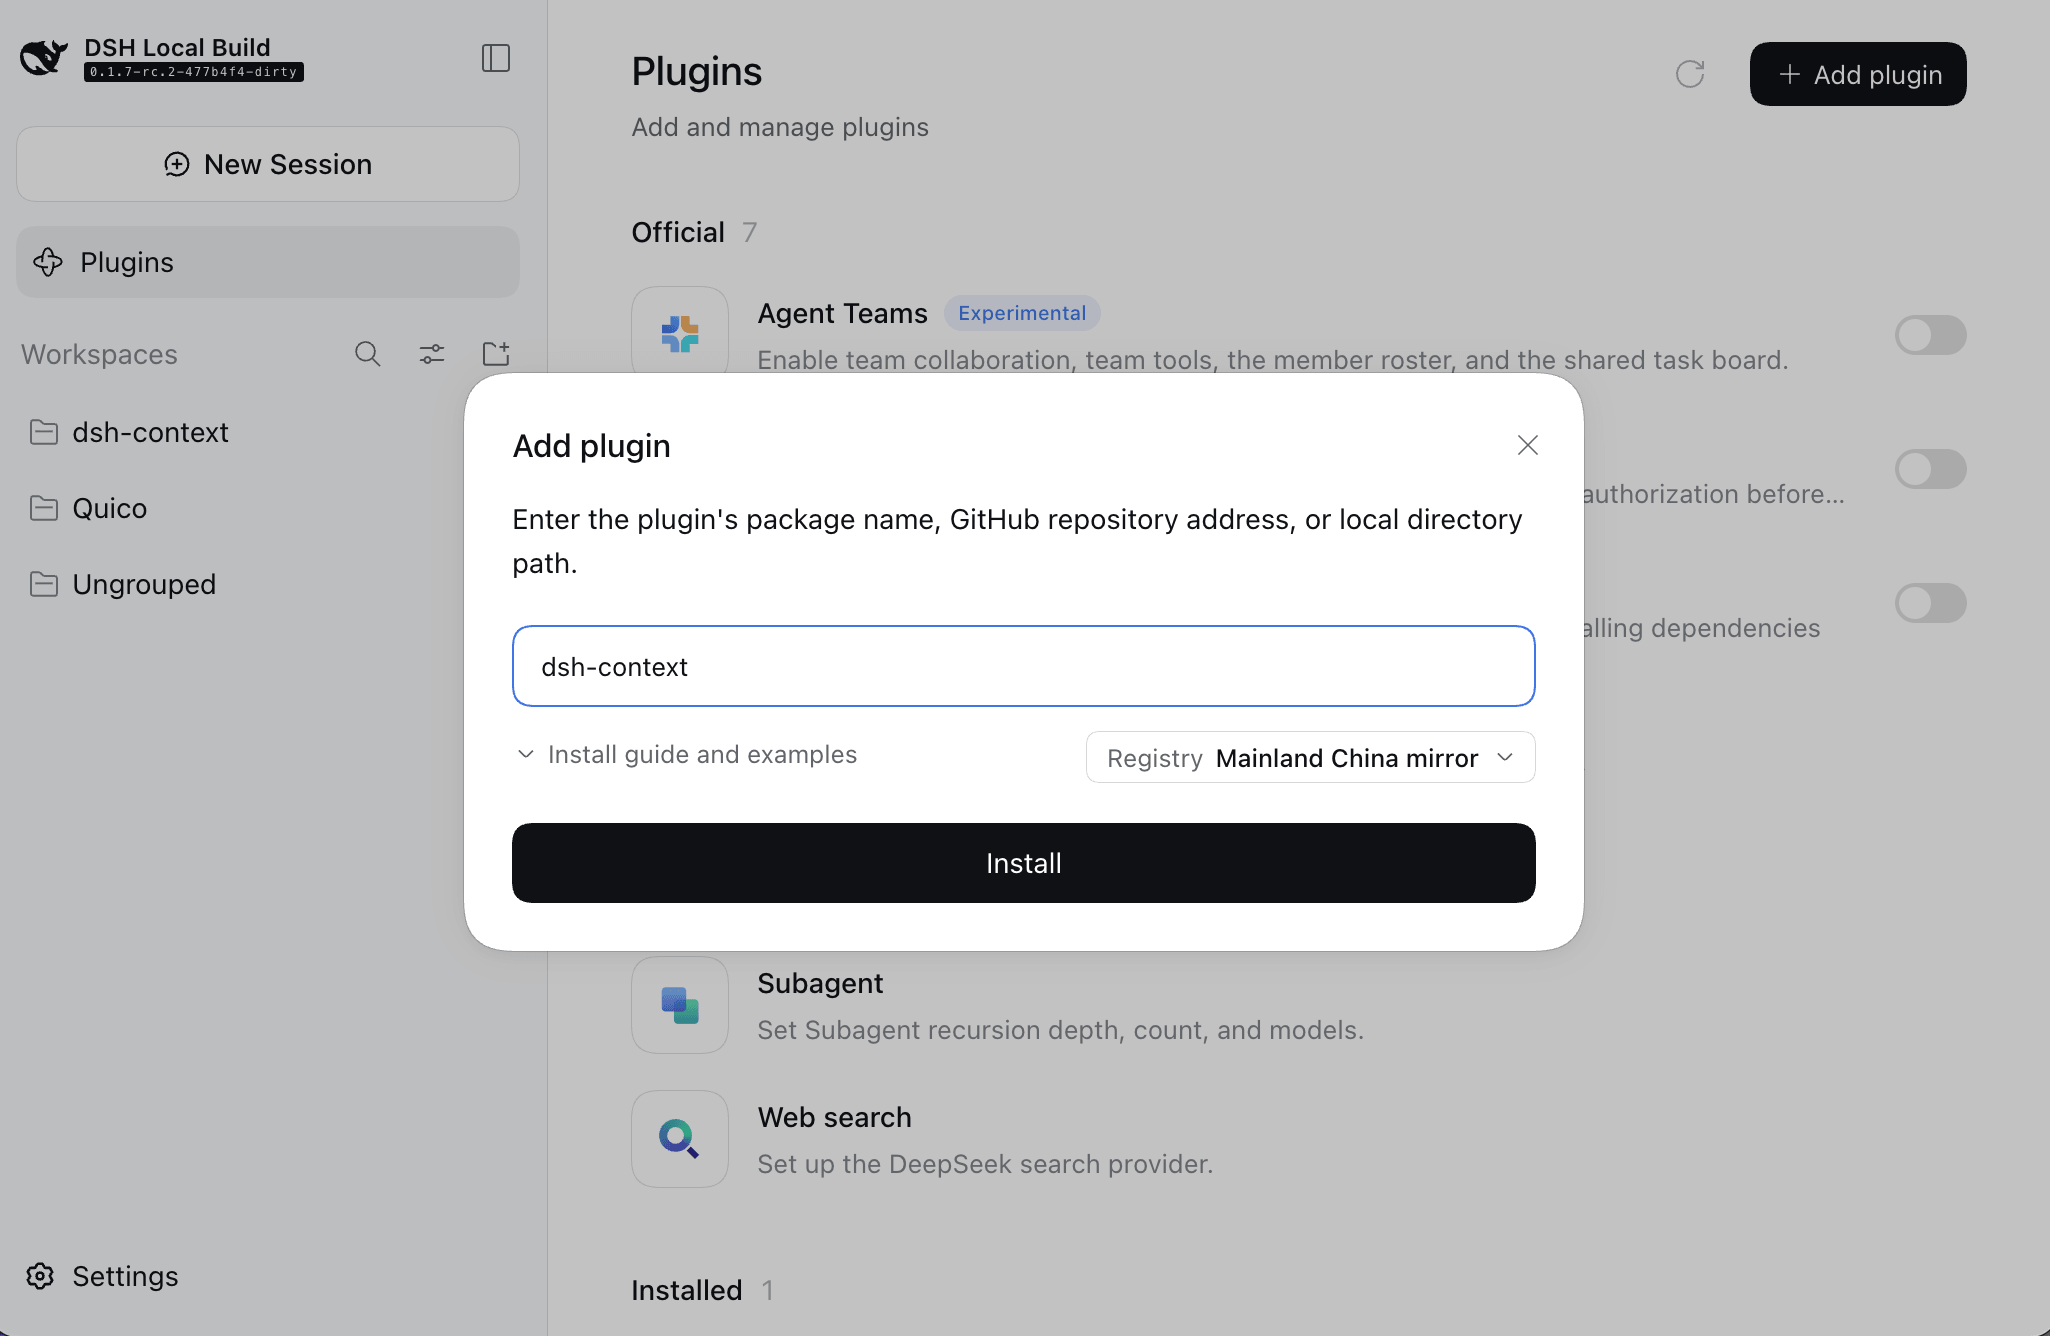
Install with dsh cli
Install dsh-context plugin from DeepSeek Harness:
dsh plugin --profile web add dsh-context
Or update the dsh-context plugin:
dsh plugin --profile web update dsh-context@latest
Then start the web UI with dsh web. No build step, no restart.
Use it
Four surfaces, one story — what your agent is carrying, how it got there, and what it did with it:
| Where | What you get |
|---|---|
| Context Dashboard | Every session at a glance: usage, cost, cache hit, daily activity, and per-session context profiles — filtered by range, day, group, or search, one click to jump in. |
| Context tab | The full dashboard: stats, composition, per-request trend, events, file activity, and the agent network — in every session. |
/context command |
A centered modal with the same composition and context browser, without leaving the chat. |
| Preferences card | Per-user defaults: view placement, trend granularity & mode, File Activity sort, and more. |
🗂️ The Context Dashboard
Click Context Dashboard / 上下文仪表盘 at the bottom-left of the sidebar, right above Settings:
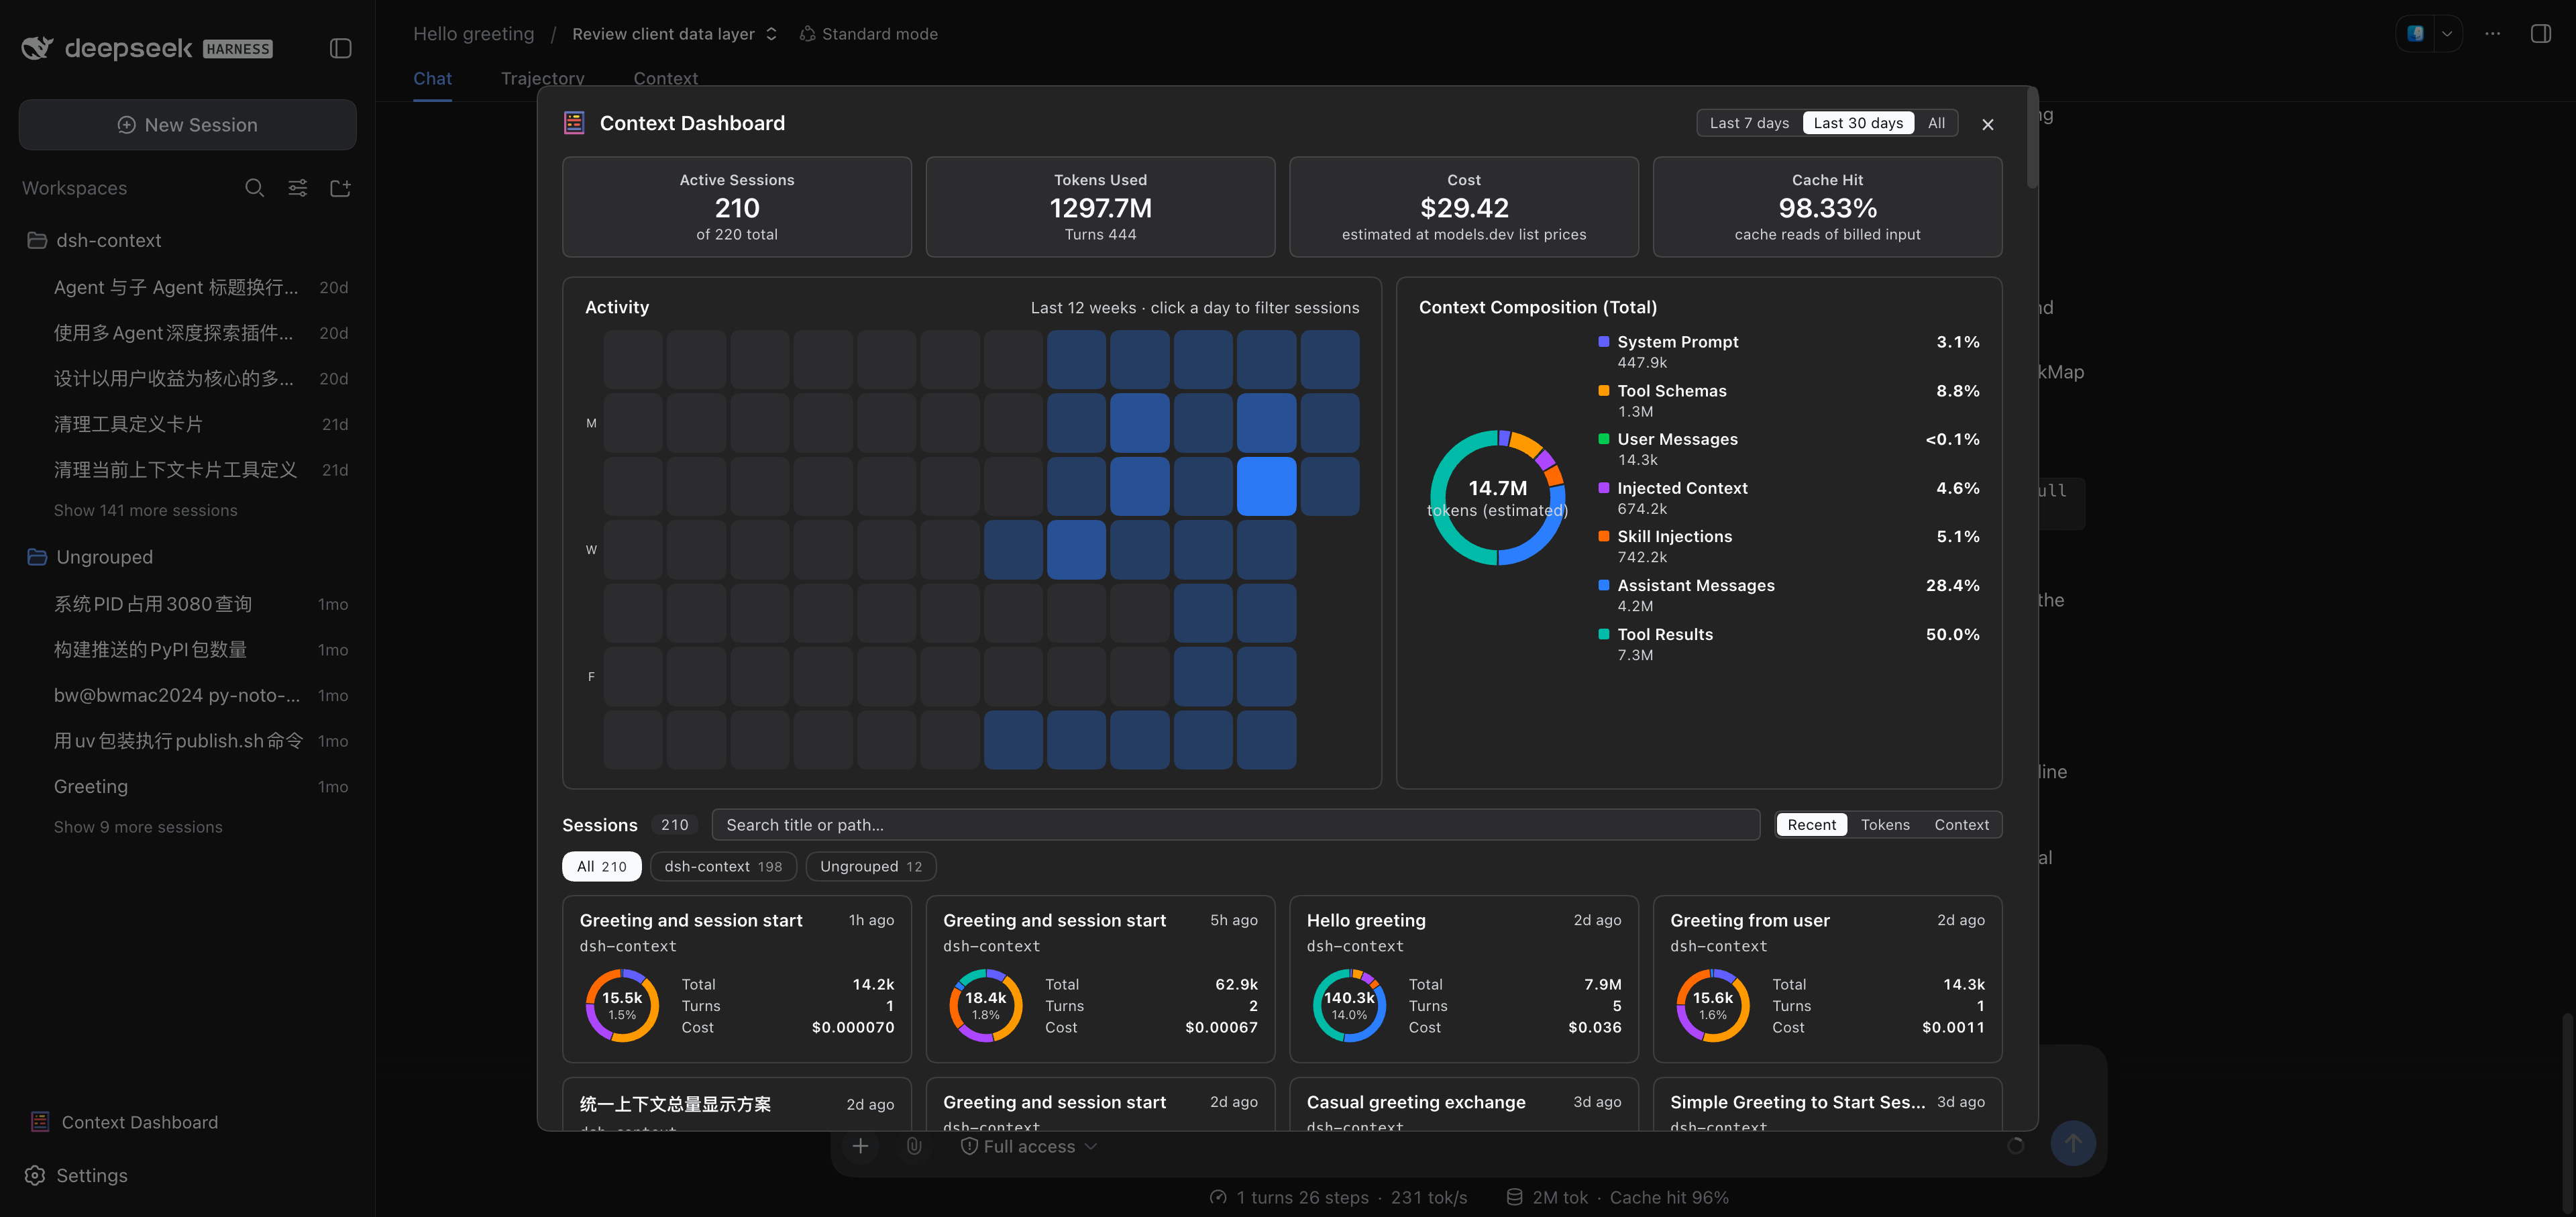
| Section | The question it answers |
|---|---|
| KPI band | How much am I using — sessions, billed tokens, estimated cost, and cache-hit rate over the picked range (7d / 30d / all). |
| 7-day usage chart | When did I spend what — each of the last 7 days' billed tokens and estimated cost as a bar pair, folded per turn off the sessions' own request times (not the session's last-active day). |
| Activity heatmap | When do I actually work — the last 8 weeks of daily billed tokens; click a day to filter the sessions that were active on it. |
| Settings entry | One row under the heatmap — the same guarded jump to this plugin's preferences as the Context tab's Plugin Info card. |
| Context Composition | Where the context windows went, summed over the range's sessions. |
| Session cards | Each session's profile: composition ring, billed tokens, turns, cost, and its workspace-group / project breadcrumb — sorted by recency, tokens, or context size, searchable, grouped by workspace. A card click opens the session. |
📊 The Context tab
Open any session and click the Context / 上下文 tab:
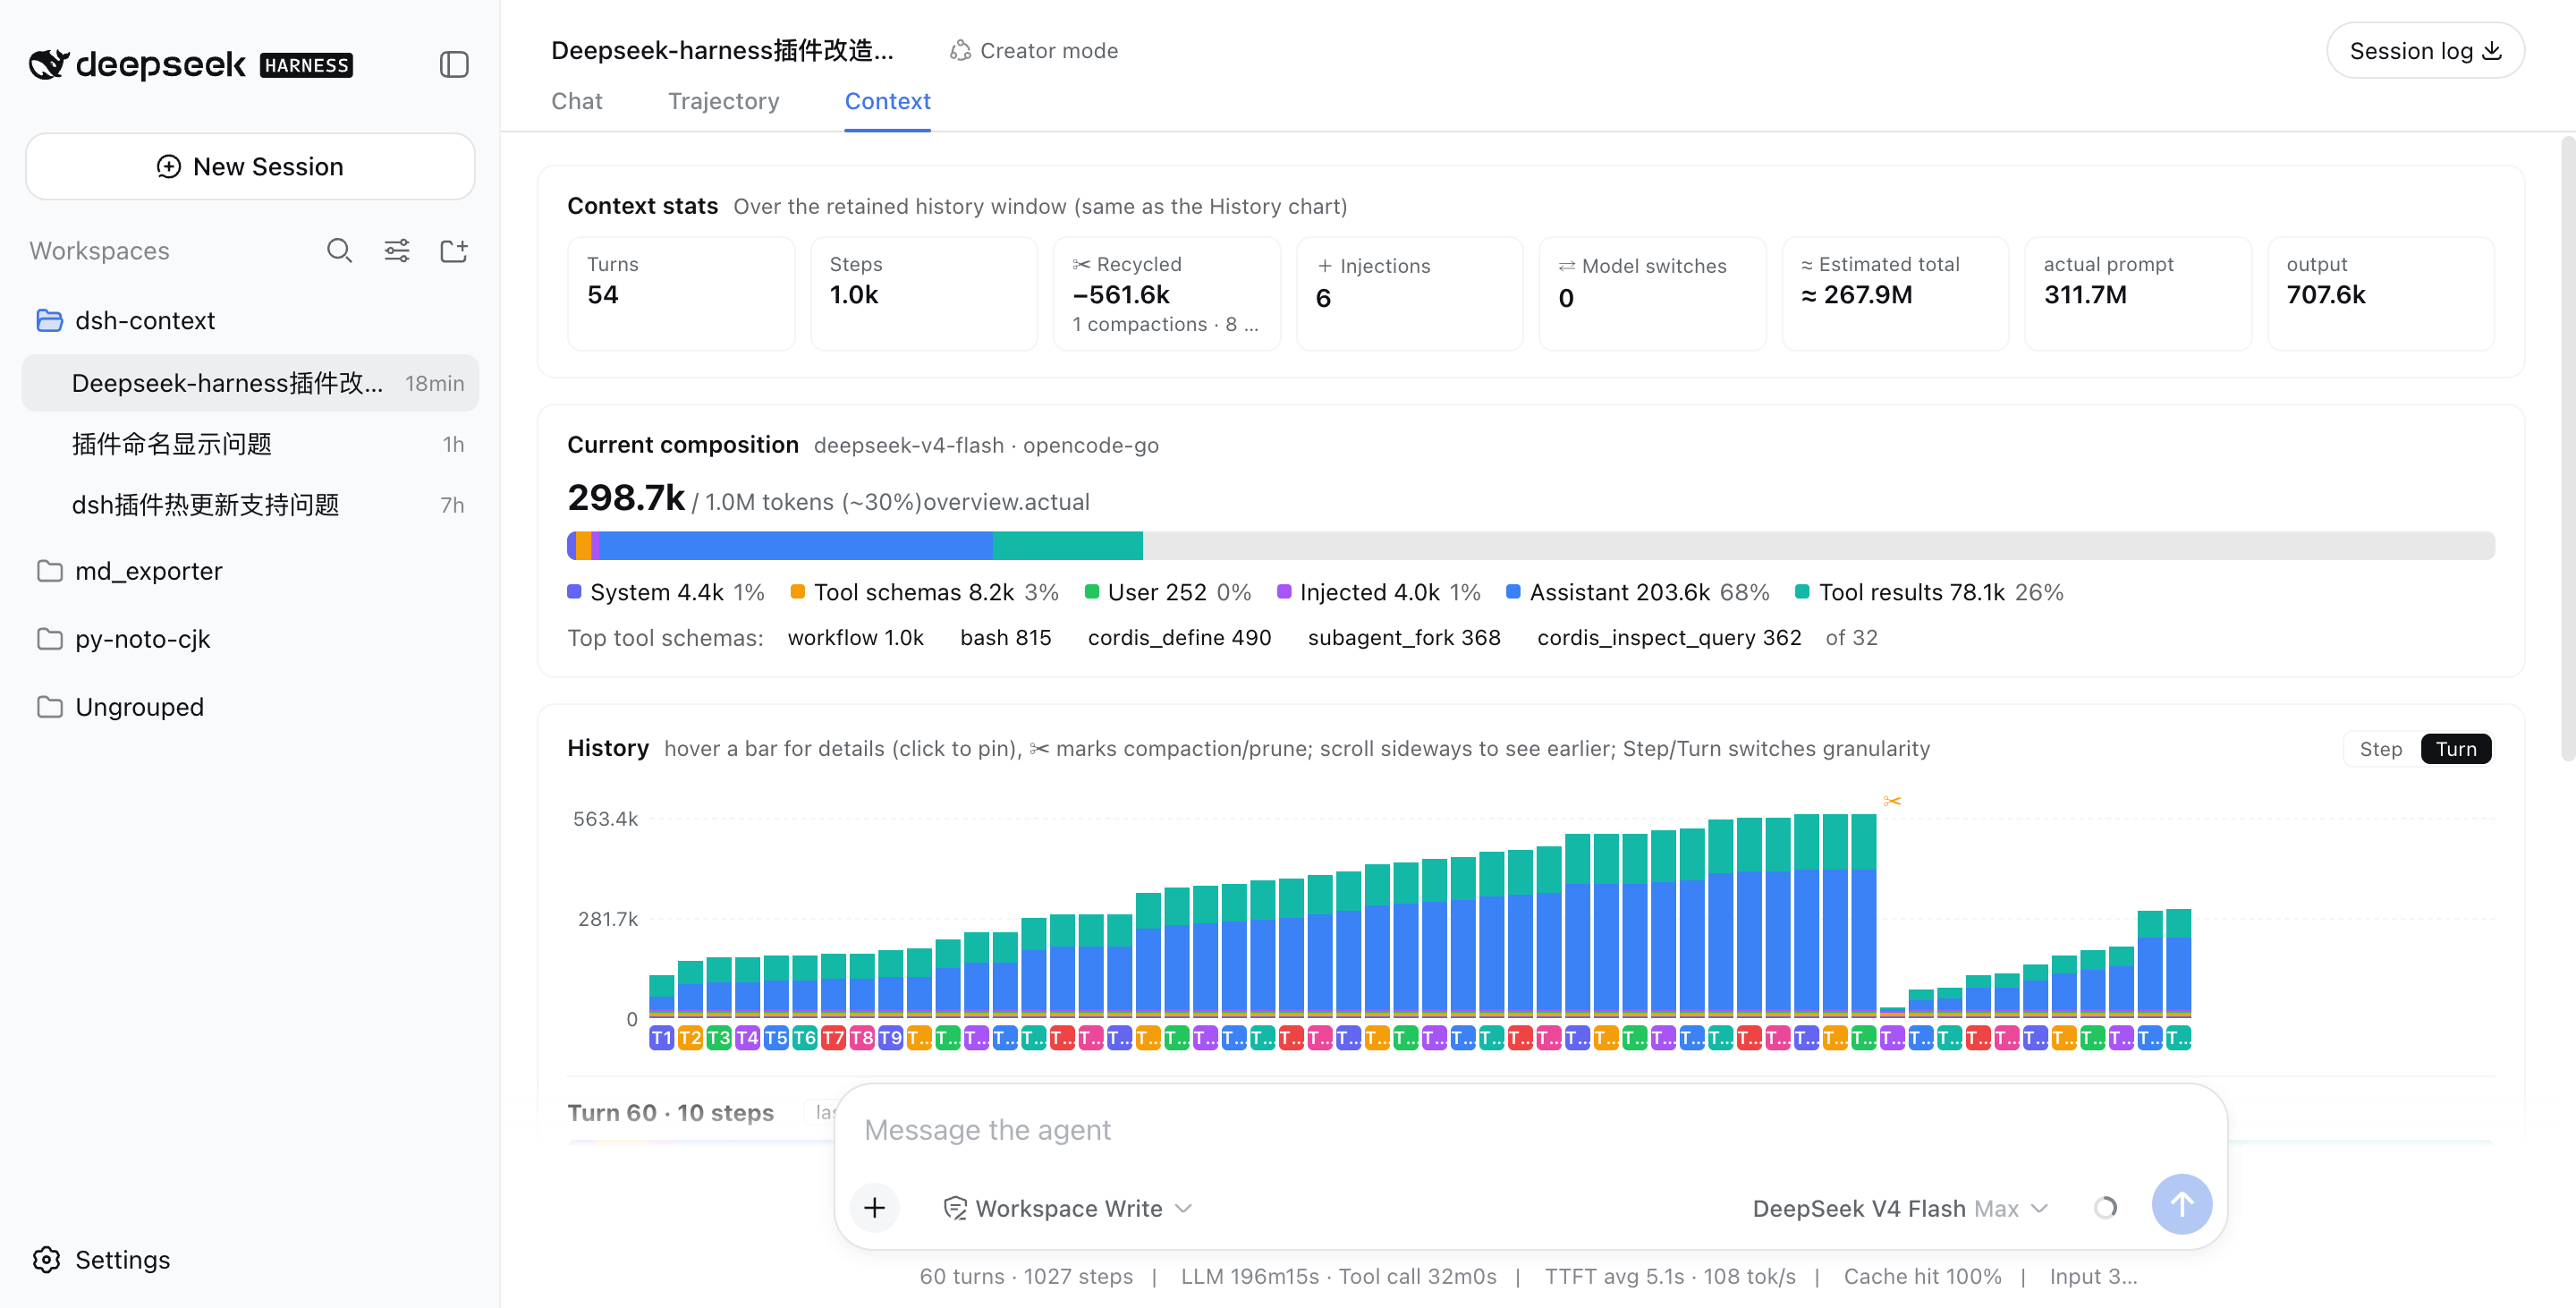
| Card | The question it answers |
|---|---|
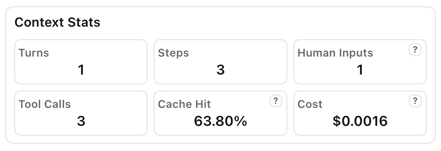
| Context Stats | Turns, steps, human inputs, live tool calls, the session's cache-hit rate — plus a cost estimated from the models.dev list prices (hover the ? for per-1M rates; DeepSeek peak/off-peak aware). |
| Token Stats | Where the billed tokens went — the same total as the chat stats line under the composer, split by composition (system, tools, messages…) with the provider-exact output closing the ring. |
| Timing Stats | How active time split across model calls, tool runs, and overhead. |
| Current Context | What's in the window right now. |
| Context Trend | Every request's size — and its story. |
| Context Browser | What any request was actually assembled from. |
| Context Events | When and why the window changed. |
| File Activity | What the agent did to your files. |
| Agent Network | The whole agent family, live. |
The headline occupancy and composition read the same official token-meter projections as the chat composer's context ring (contextPressure / contextBreakdown), so the figures always match what the ring tells you.
Context Stats
Token Stats and Timing Stats

Context Stats
🧱 Current Context — what's in the context window now

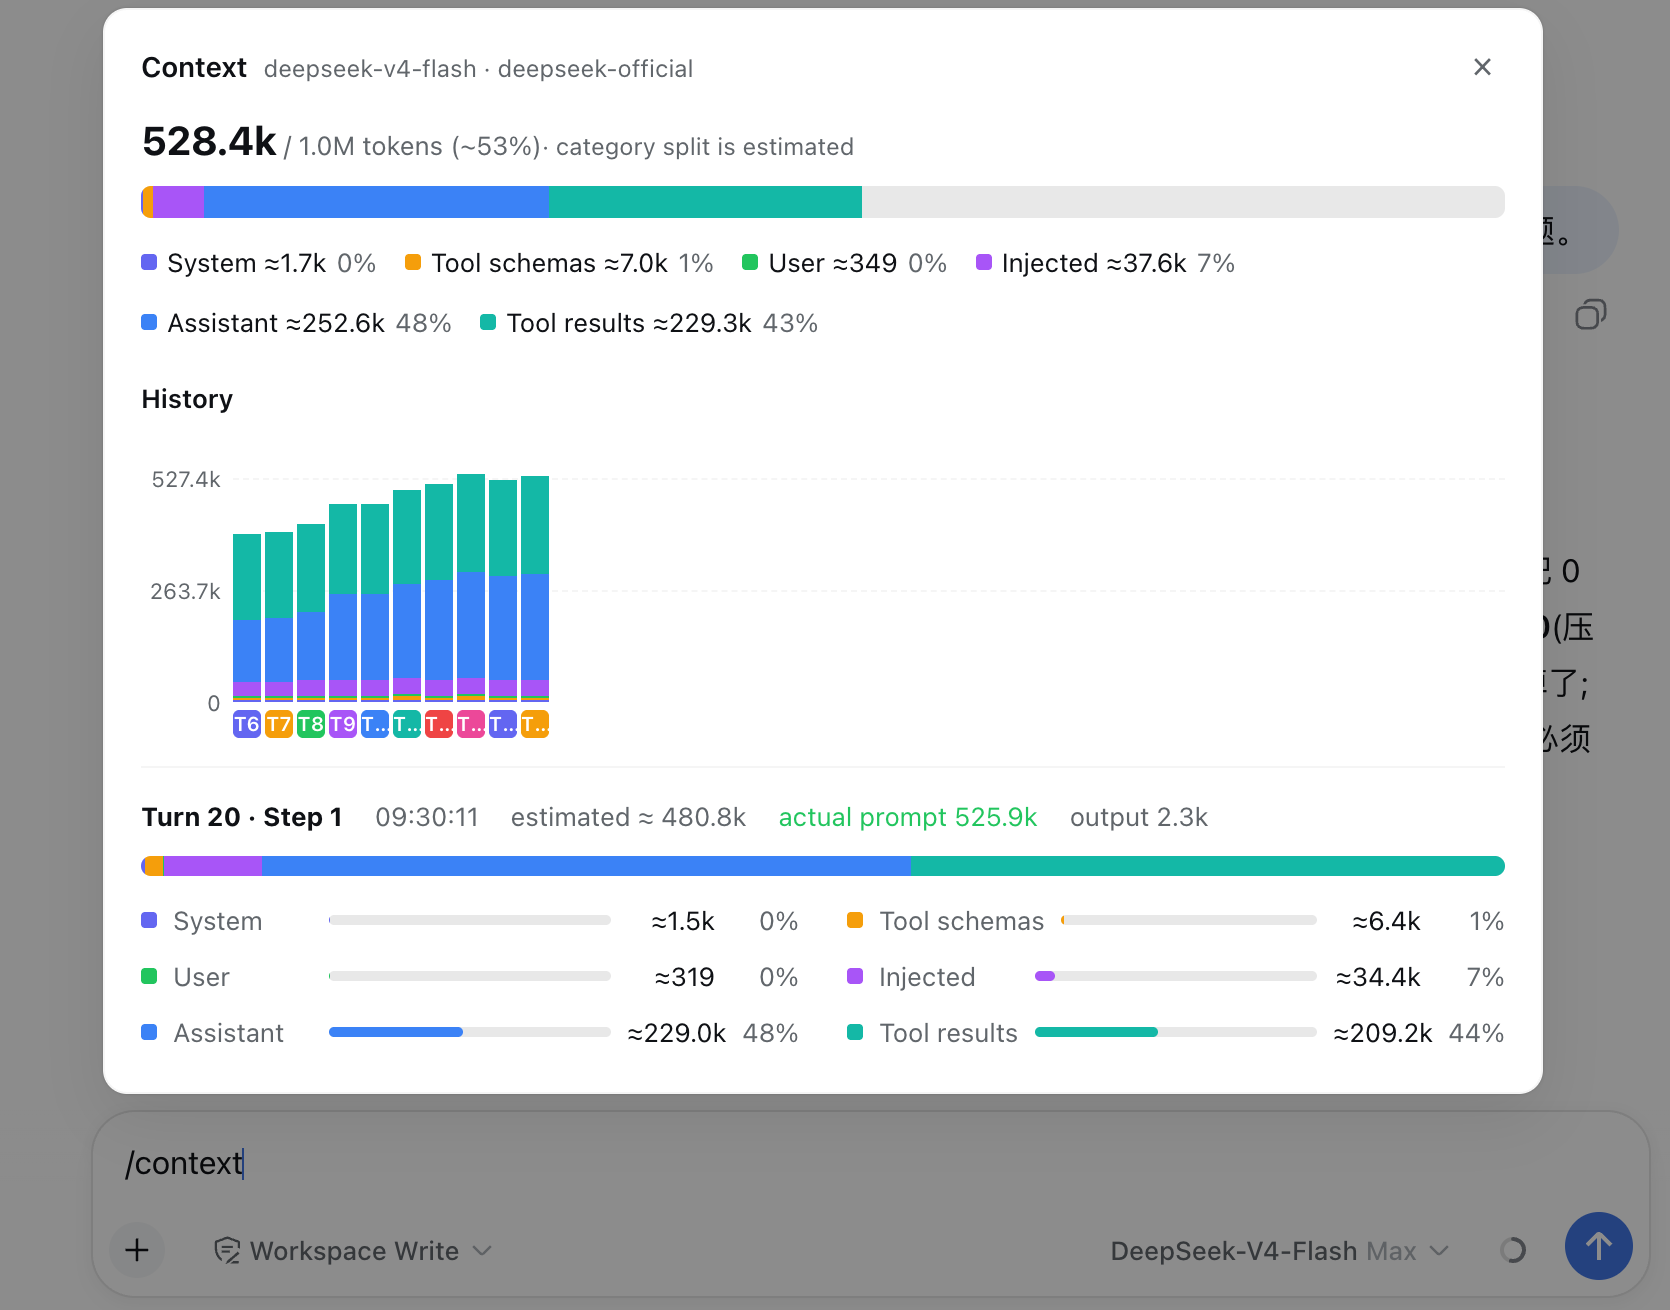
A six-color stacked bar against the model's full window (hatching = free headroom): system prompt, tool schemas, user messages, injected context, assistant replies, tool results — each with its ≈token figure and share. When a conversation starts degrading, this is where you see which part is responsible.
📈 Context Trend — how the context grew and evolved by turn or steps
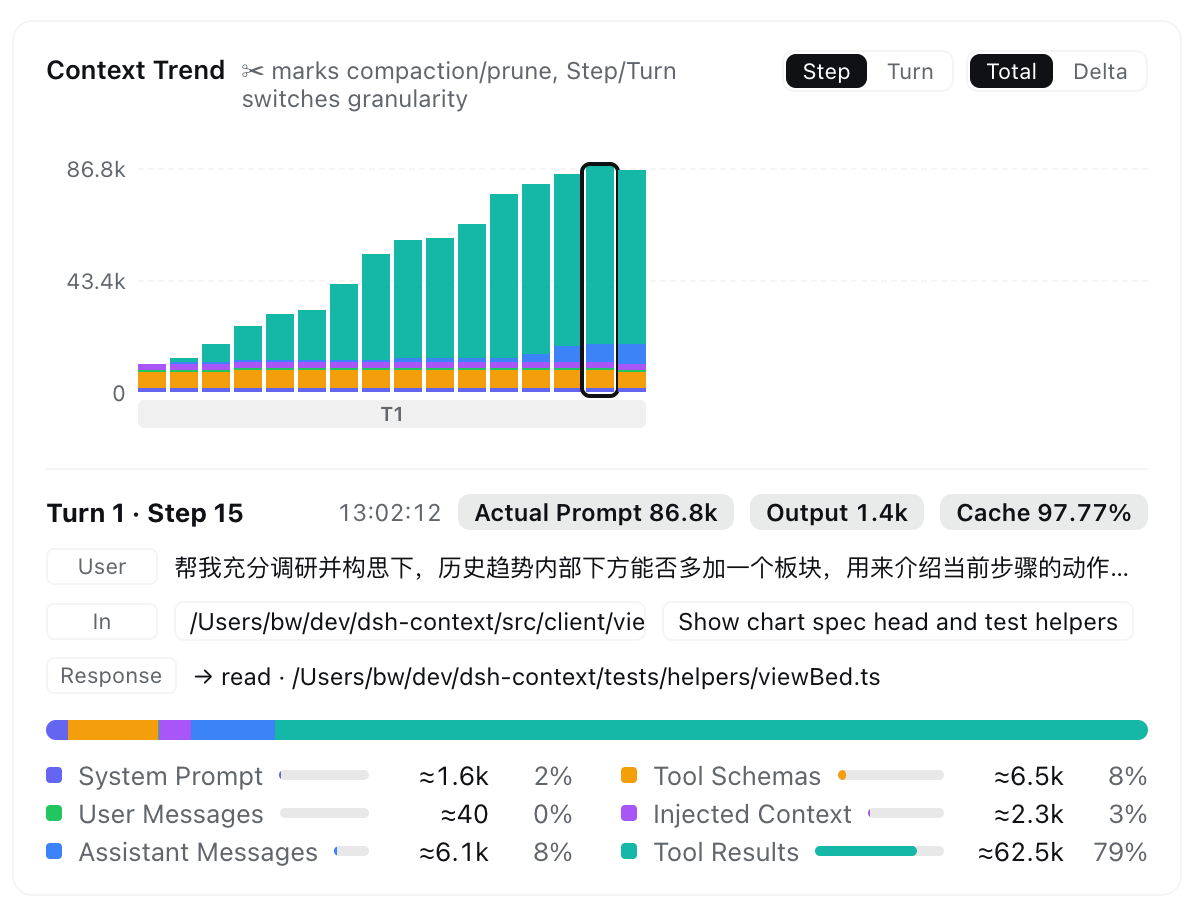
One stacked bar per model request — finer than per-message — so you watch the window grow turn by turn:
- ✨ Step brief — three plain-language rows under the chart: User recalls the message that opened the turn, In lists what newly entered (usually the previous tool results), Response shows the reply and/or tools called. Click a row to open that exact message in the Context browser.
- ✂ marks the events — compactions and prunes are pinned to the bar where they happened, so the drops explain themselves.
- Read it your way — Step / Turn granularity, Total (cumulative makeup) or Delta (each request's signed change), and sideways scrolling through the whole session. In Delta mode, growth piles up above the baseline and a compaction dives below it:
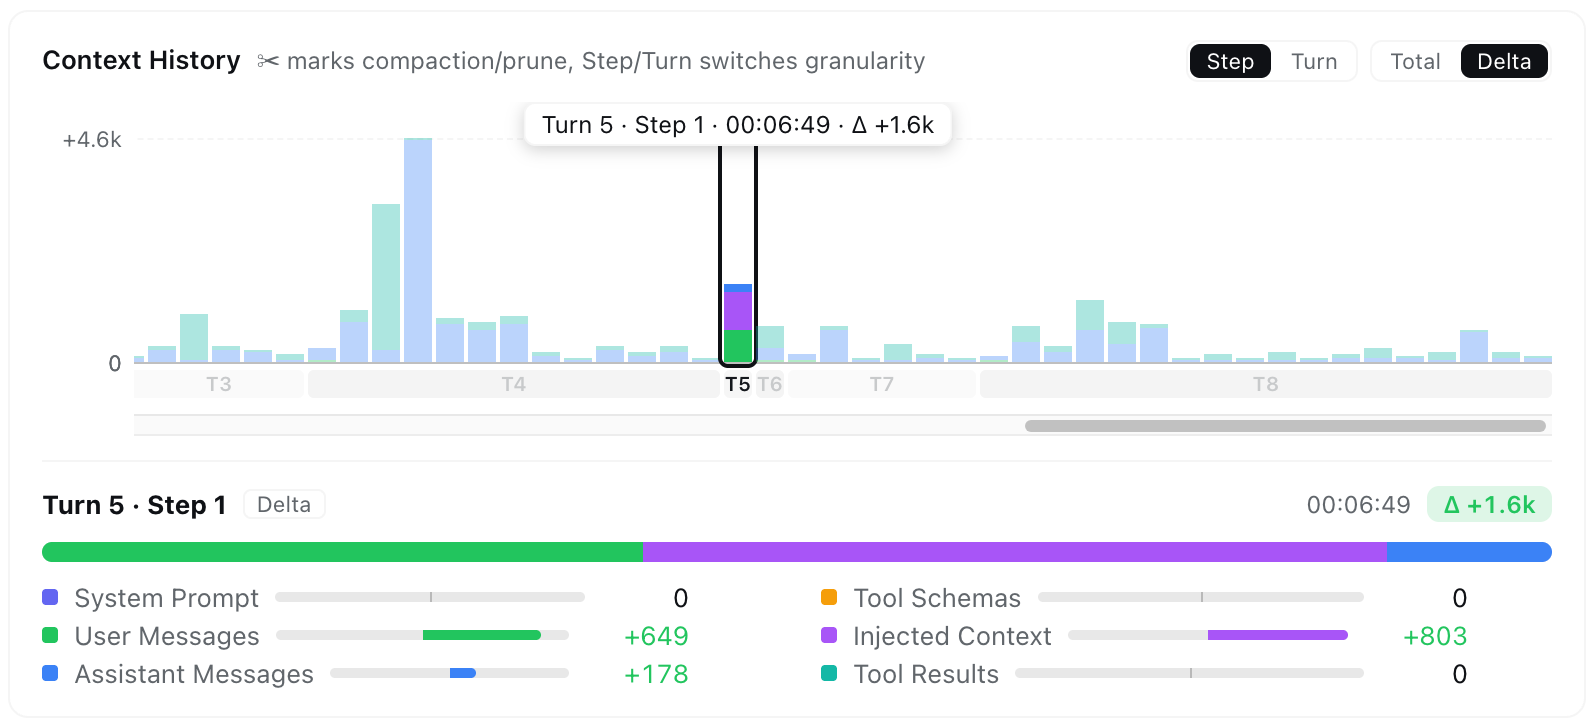
- Hover & pin — scrub for an instant tooltip; click to pin the full breakdown, with provider-reported Actual Prompt / Output / Cache next to the estimates.
- Live linkage — hovering a bar previews that step's assembled context in the Context browser beside the chart; leaving the chart returns to your own pick.
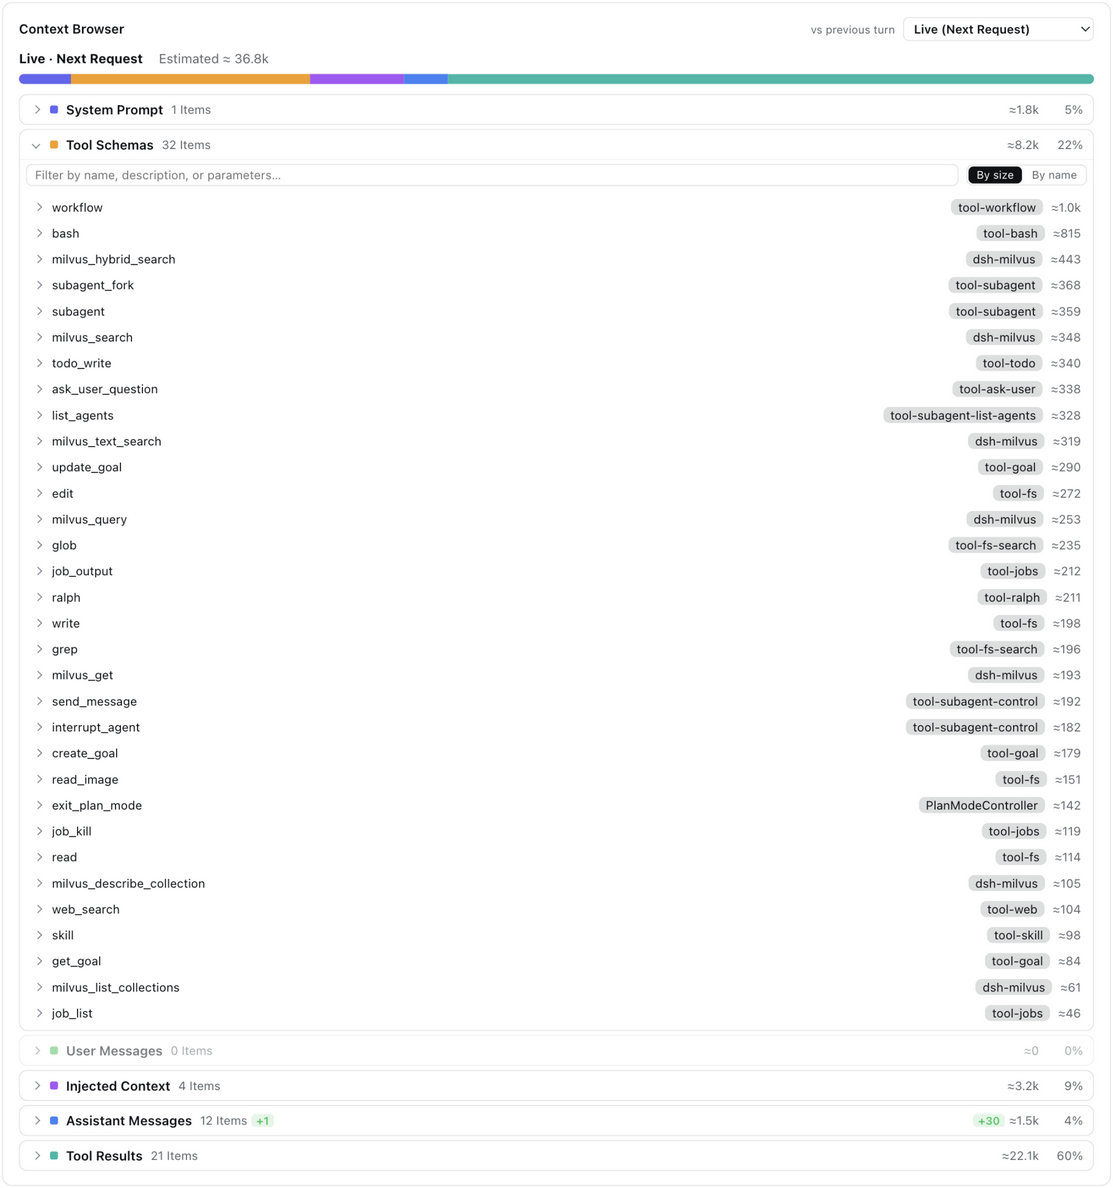
🧭 Context Browser — open the box of any request
Pick Live (next request) or any retained step, and browse what that request was assembled from: seven collapsible categories expand into one row per element with its token price, and every element expands again into its actual content — the system prompt, each tool's JSON schema, message text, reasoning, tool arguments, and tool outputs. Skill content (the available-skills catalog, /skill invocations, and skill-tool loads) has its own Skill Injections category, so a stealthy skill's context footprint can't hide inside the injected-context and tool-result buckets.
- Who provides each tool — every tool-schema row carries a best-effort source chip:
tool-*first-party packages,dsh-*capability packages,mcp:<server>proxies, or the exact plugin watched live fromtools.register(). Sort by size / name, and filter every category by its own searchable fields:
- Tool results open into the full call — the tool name and arguments with its OK/error status, the result body with line count and a Raw / Markdown toggle:
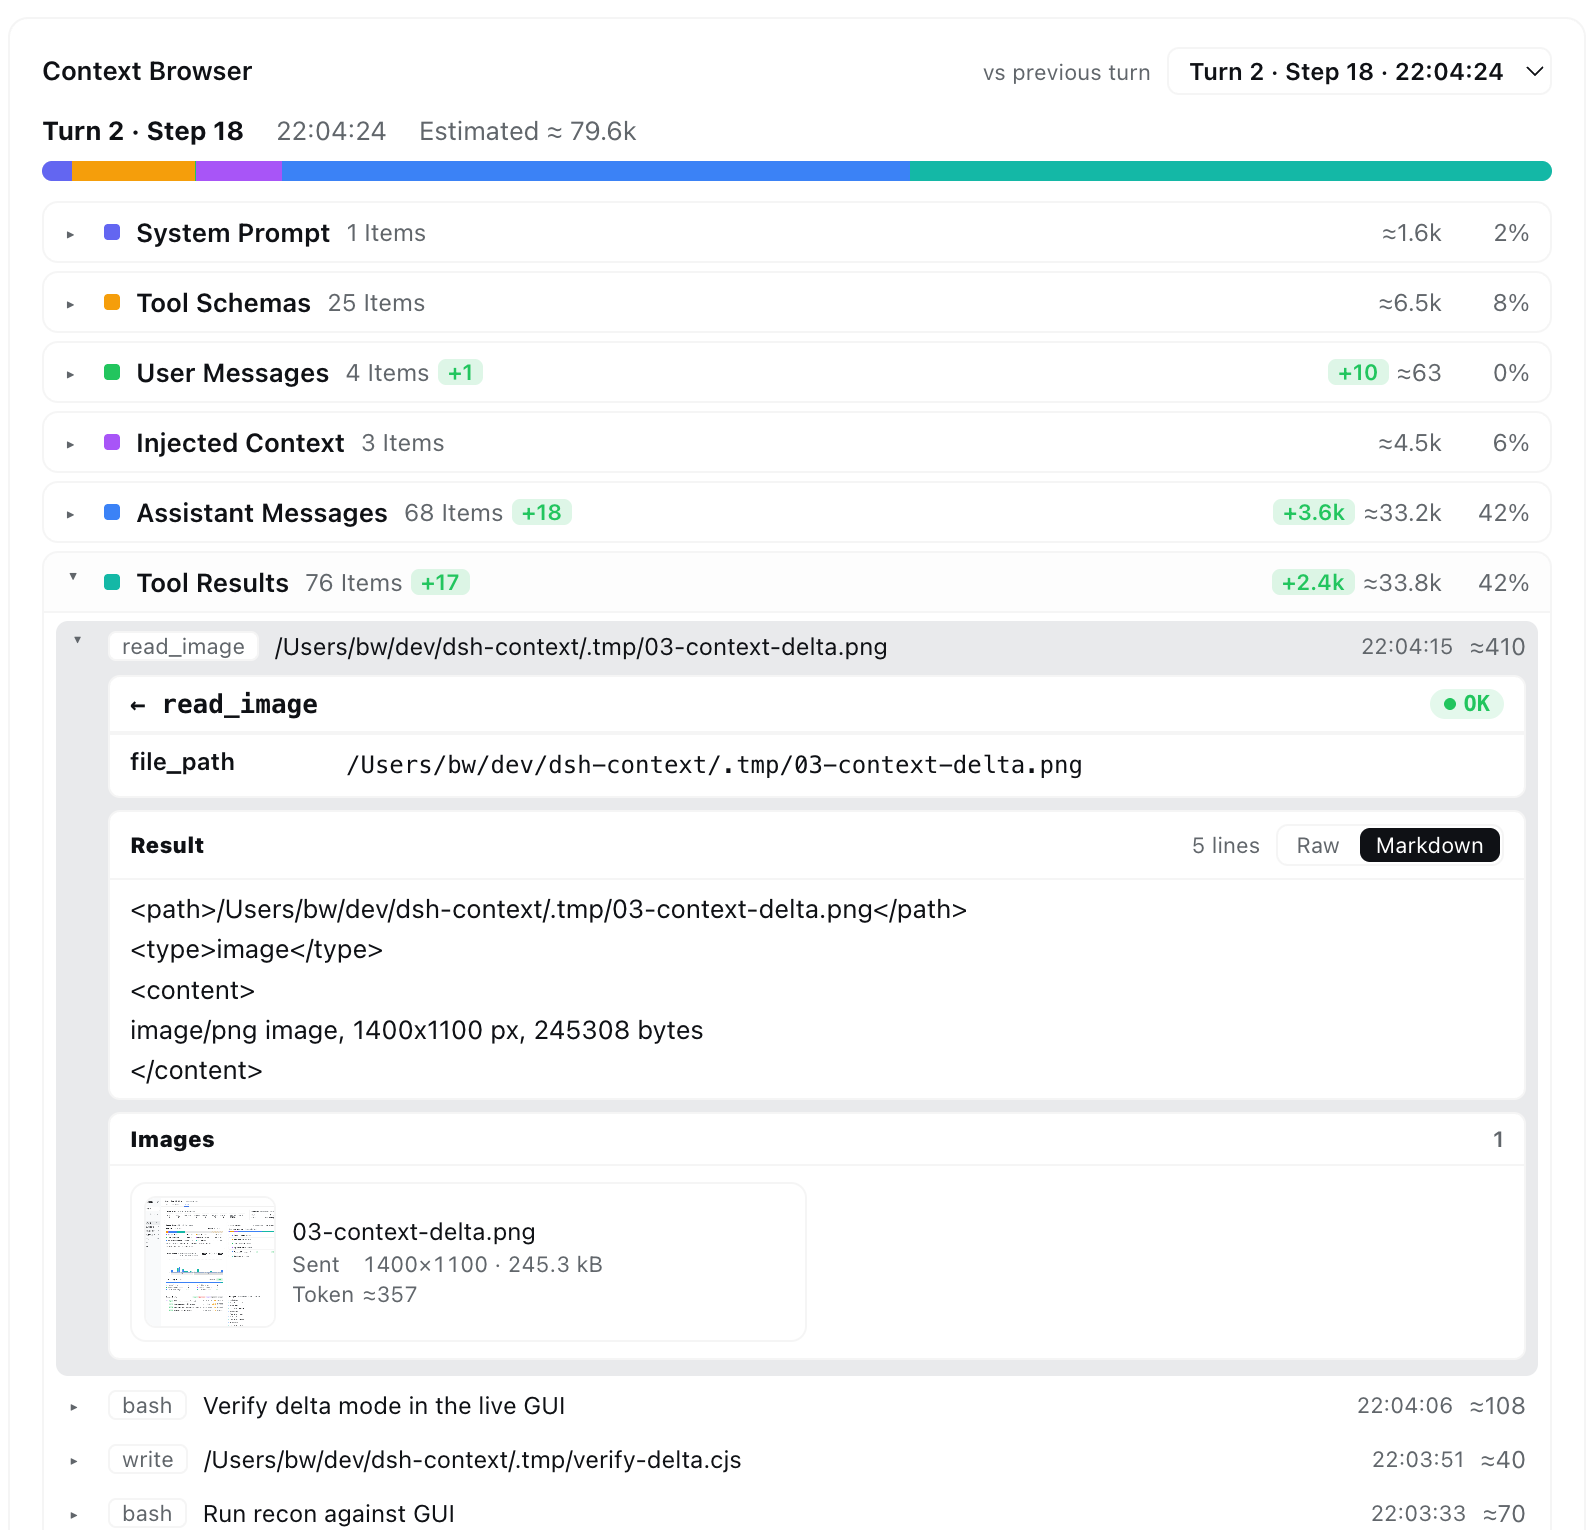
- Image payloads render as cards — thumbnails with name, dimensions, stored size, and the official DeepSeek image-token estimate (the dsh multimodal pipeline, e.g.
read_imageresults and image attachments):
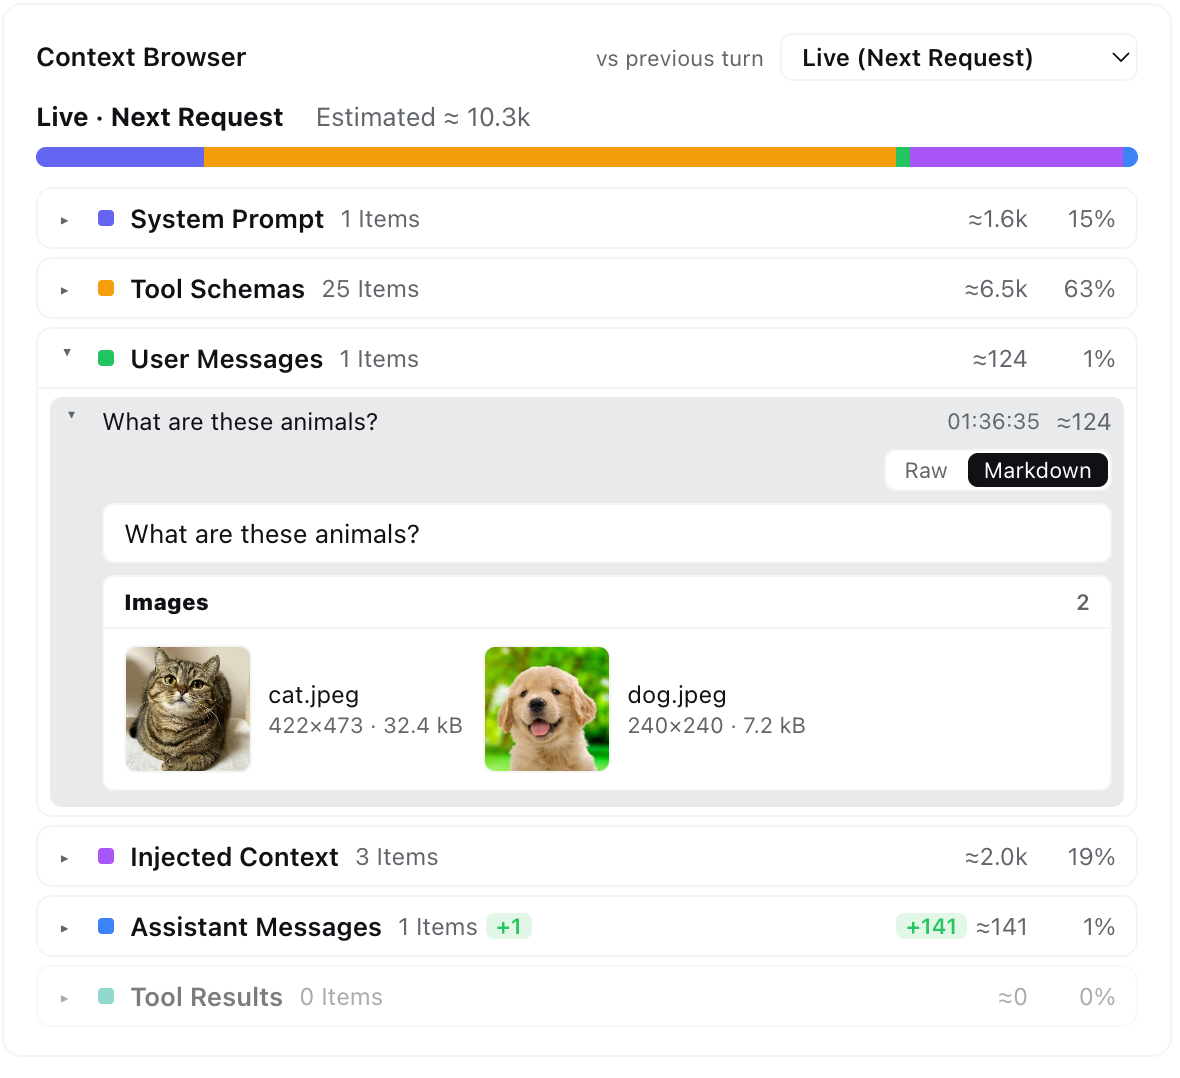
- Diff against the previous turn — signed delta badges per category (
+Nitems,±Nktokens) tell you what a turn added or reclaimed at one glance. Steps older than a compaction are reconstructed from the removed-message archive — and the card says so when a step's makeup is only approximate.
⚡ Context Events — when and why the window changed
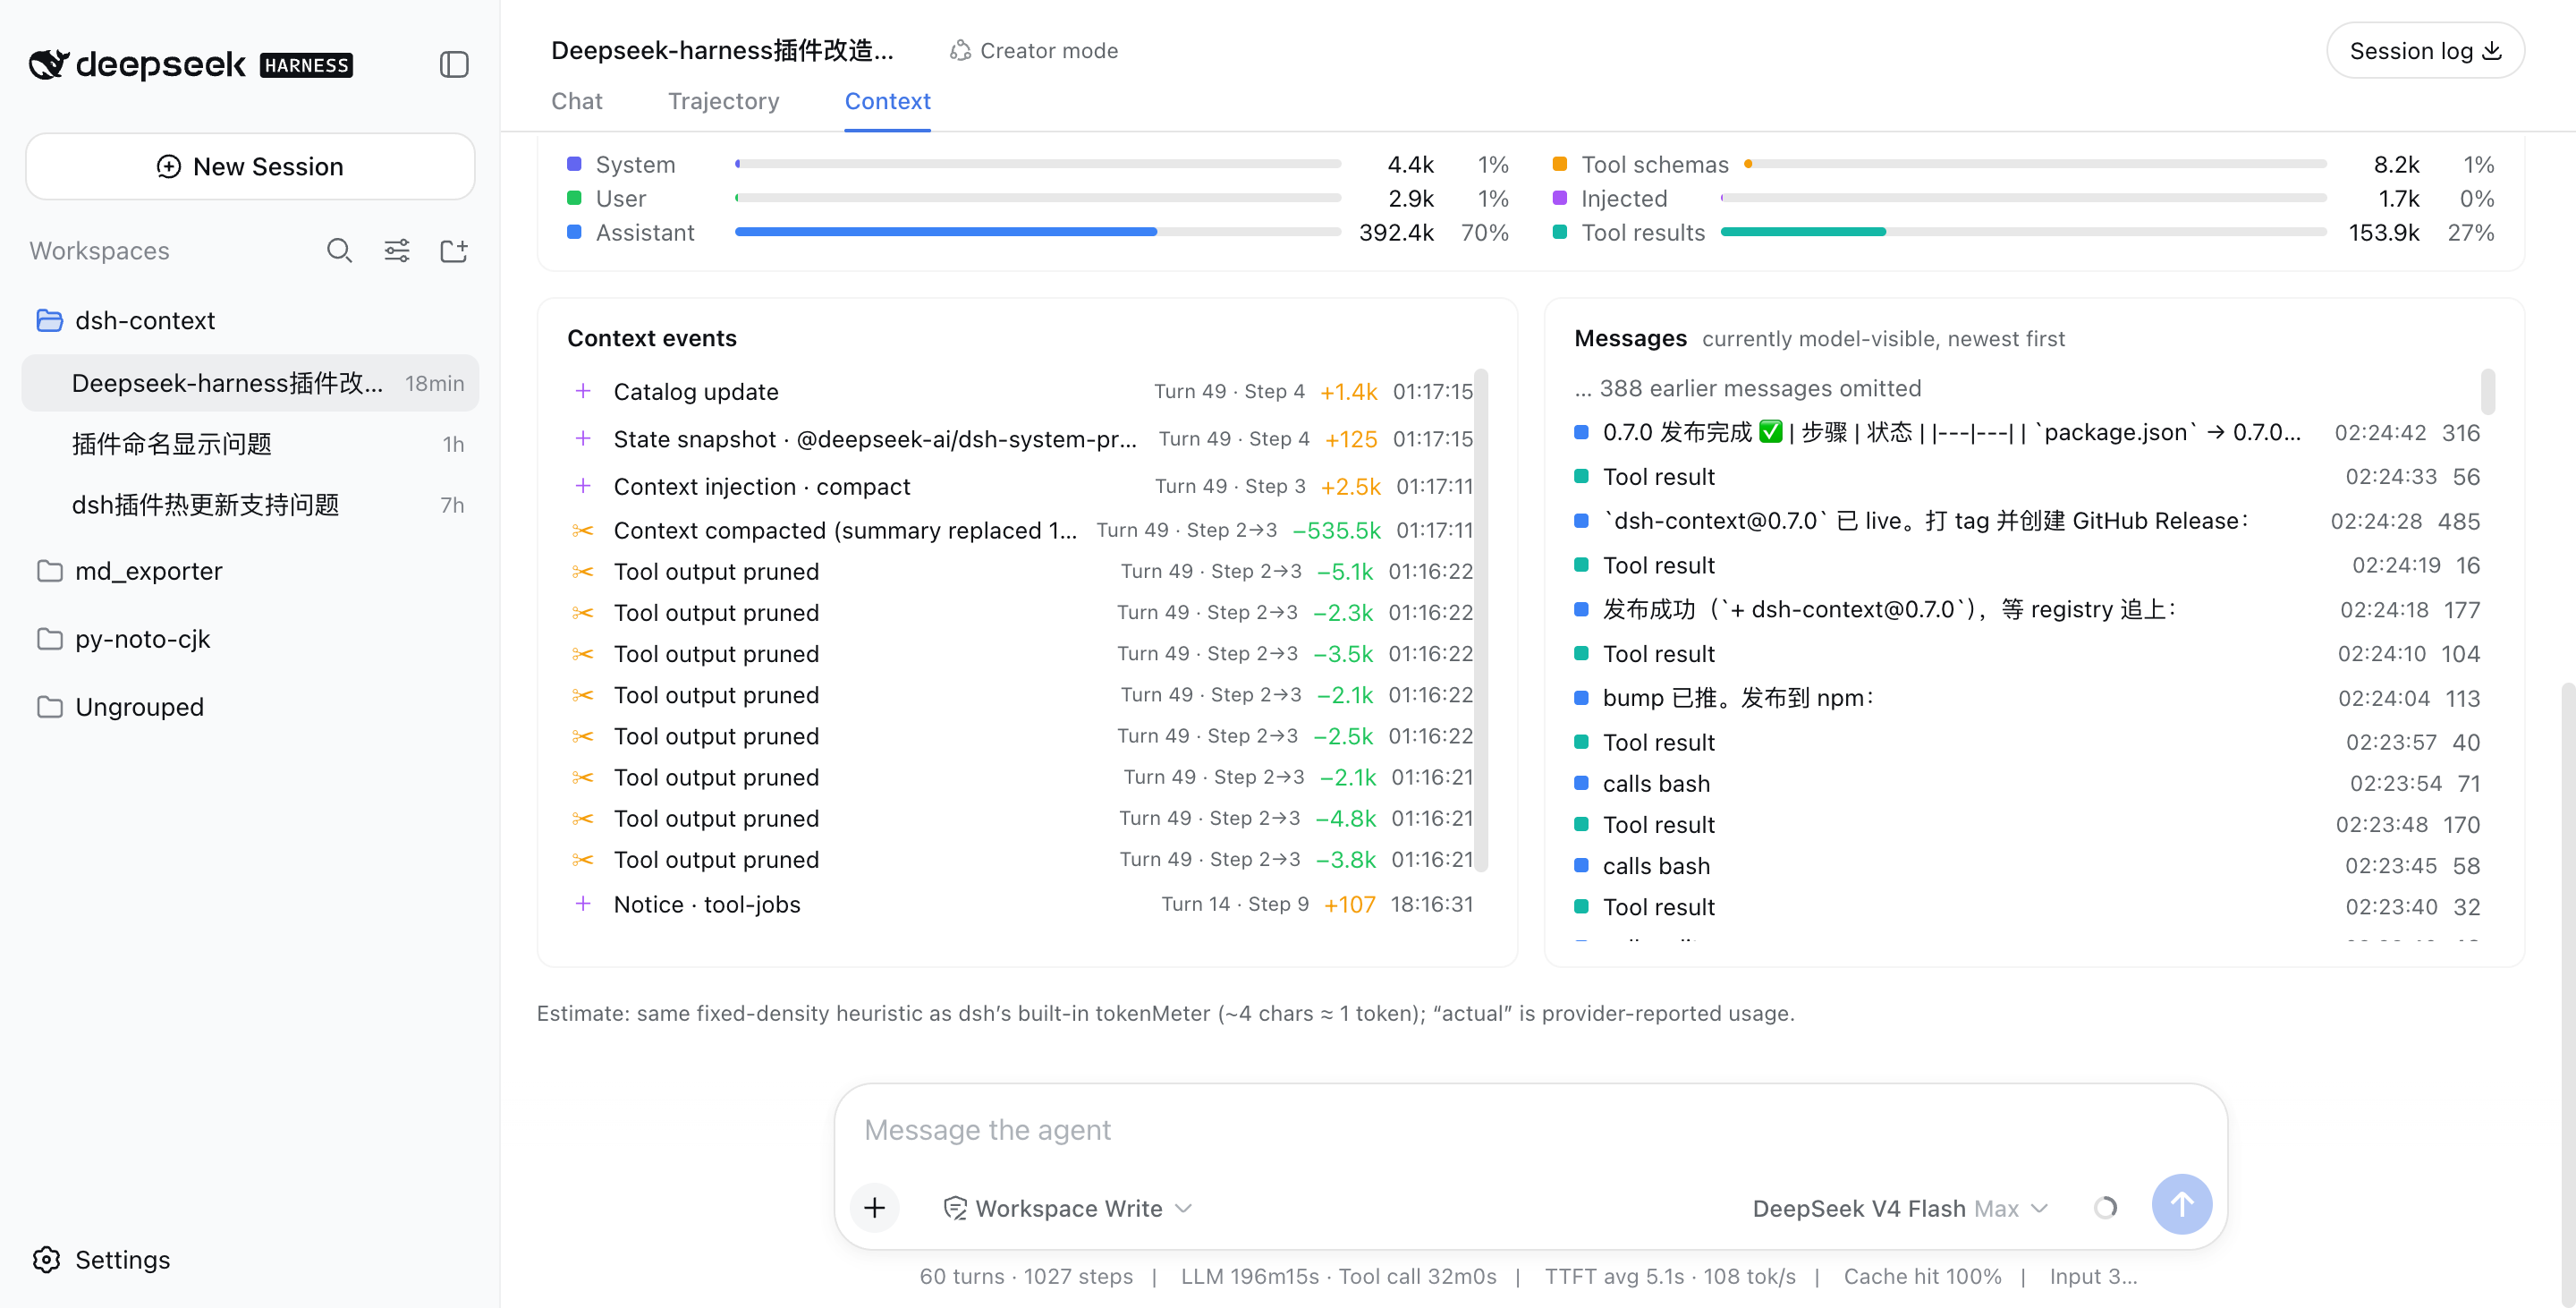
Every injection, compaction, prune, model switch, and plan-mode toggle — labeled with its producer (instruction file, plugin id, skill name), its net token delta (compactions show what they reclaimed), turn/step, and time. The Inject / Compact / Prune / Switch / Mode chips filter the log by kind, each carrying its whole-session event tally.
📁 File Activity — what the agent did to your files
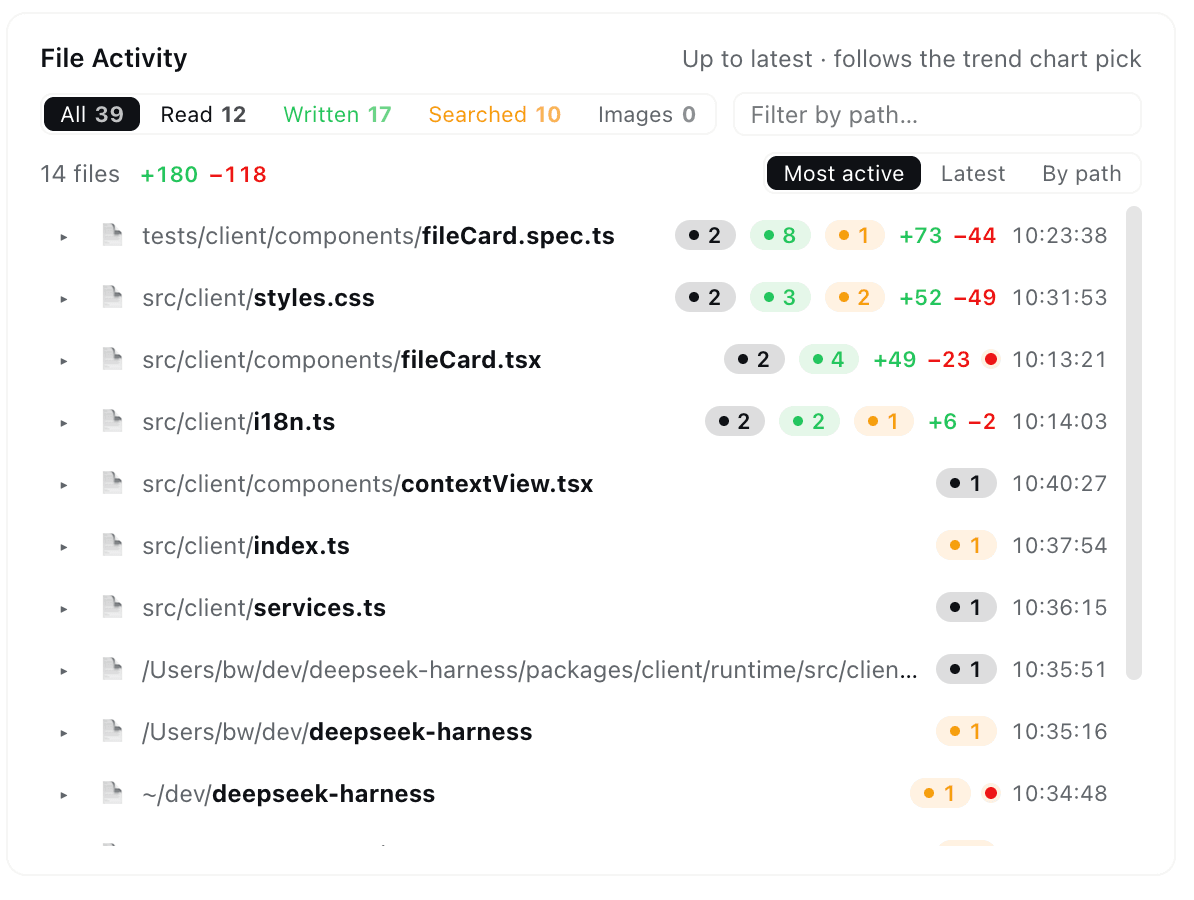
One row per touched file — read, written, or searched — aggregated up to whichever step you pick on the trend chart:
- Per-purpose counts with header chips doubling as filters (Read / Written / Searched / Images) and a path search box.
- Line deltas — every
edit/writecontributes its estimated+added / −removedfootprint, per file and summed. - Every mode counts — native tools, the Minimal preset's
str_replace_editor, and the nested calls inside PTCrun_codeprograms are all folded into per-tool rows. - Searches land on real files — matched files get their own ops rows with hit counts.
- Click a row to expand its full operation log — every op jumps straight to the exact tool result in the Context browser.
- Click a file name to open its preview in the right Sidebar (dsh 0.1.5-rc.1+), exactly as the built-in Files sidebar does — the same viewer, the same tab-per-file behavior. On a harness without that column the name opens on your system as before.
🕸 Agent Network — the family portrait
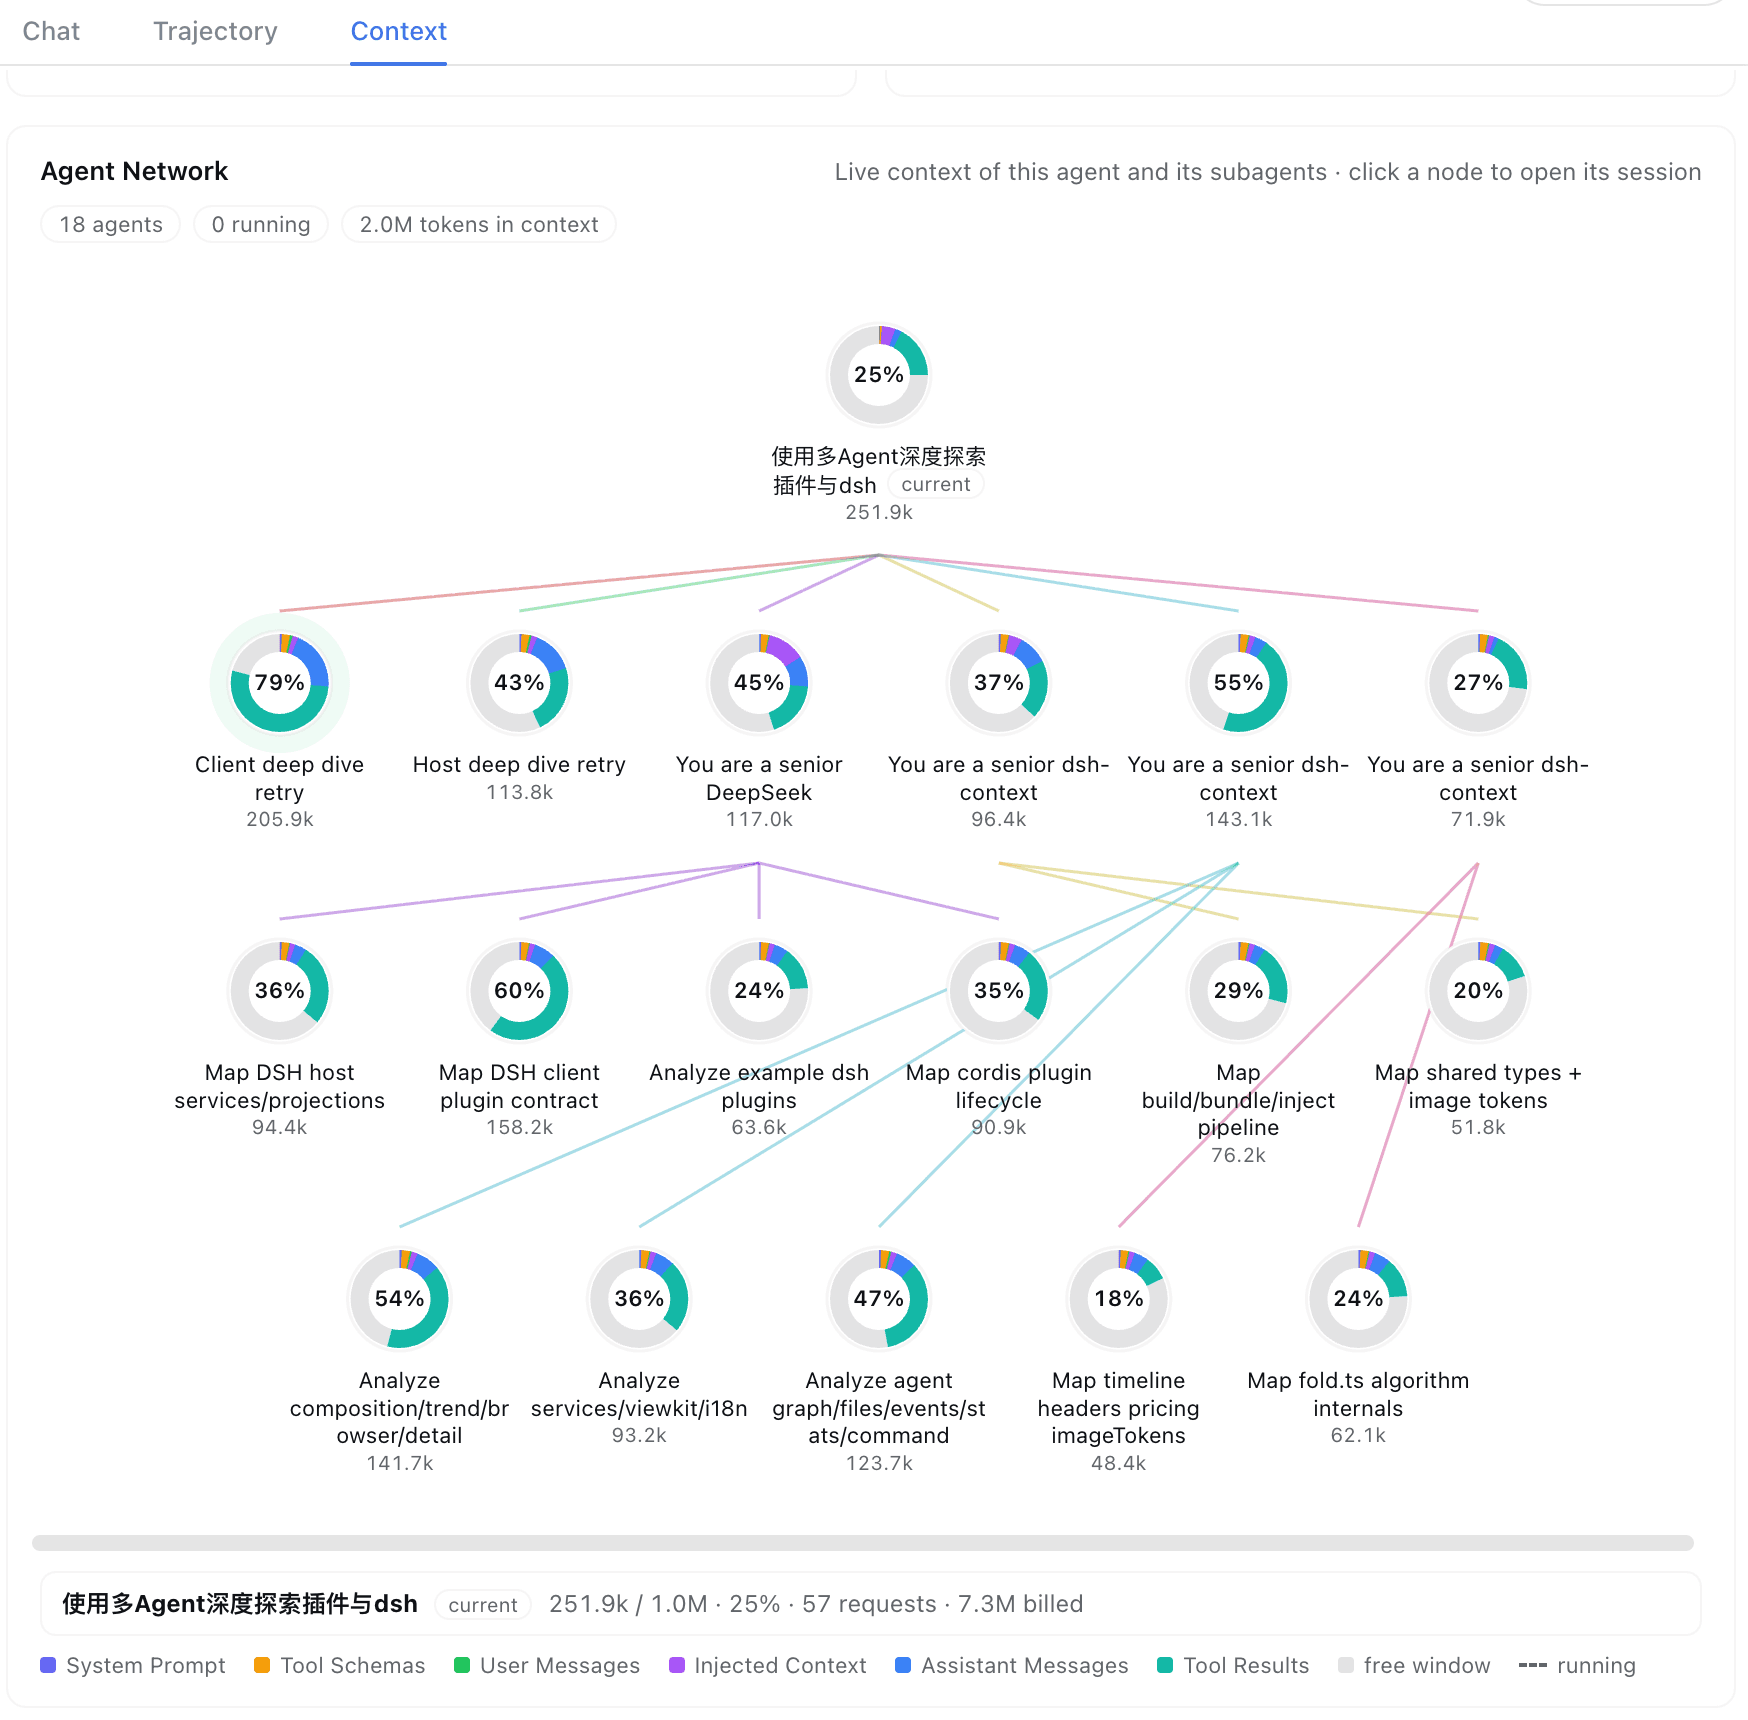
The current agent, its parents, and every subagent — one node per agent, colored edges for the lineage, multi-level delegation on one map. Each ring is that session's composition scaled to its window occupancy; hover for tokens, requests, billing, and active time; click to jump into that session's own Context tab. Running agents breathe with a green pulse.
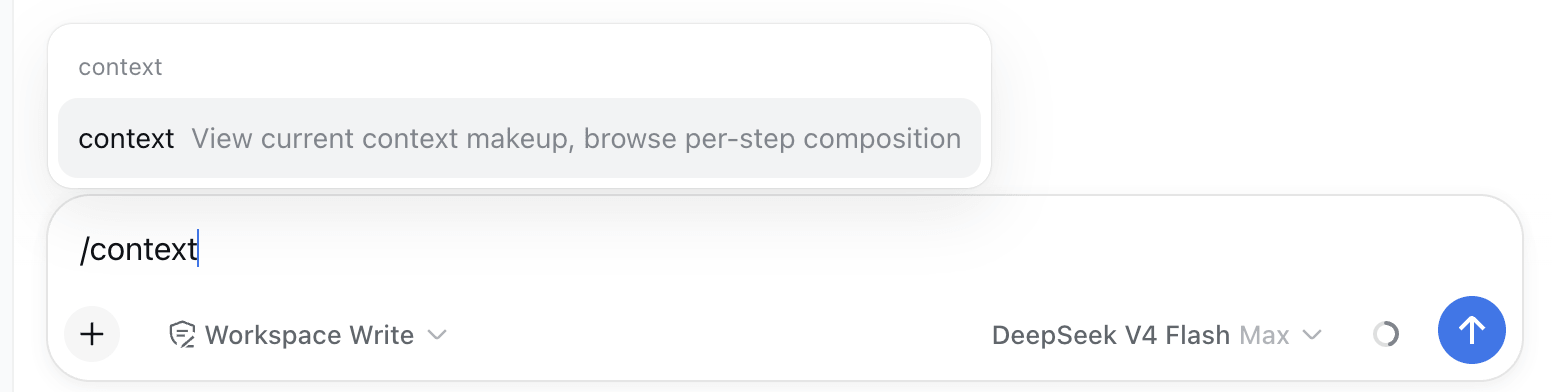
⌨️ /context command
Type /context (or pick it from the / menu) and press Enter:
A centered dialog opens with the Current Composition card and the Context browser — the same composition bar, per-step picker, and vs previous turn diff badges as the tab:
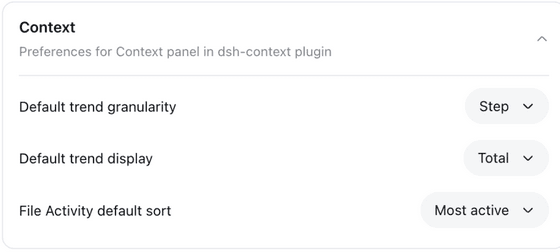
⚙️ Settings
The Context preferences card holds this plugin's per-user settings — default placement, trend granularity (Step/Turn), trend mode (Total/Delta), tool and File Activity sort, and the sidebar insights entry. Where it lives depends on your dsh release:
- dsh 0.1.7+ — the sidebar Plugins entry → the dsh-context bundle's page → its Configuration section (the card is served by the entry's live Config form).
- older releases — Settings → Plugins → Plugin configuration → the Context card.
In-chart and in-card toggles stay per-view and never overwrite the stored preference.
Good to know
- Estimates vs actuals — category figures use dsh's own fixed-density heuristic (the same one as its built-in token meter); the pinned trend details show provider-reported actuals next to them, and the Token card pairs its ≈-estimated composition shares with the provider-exact billed total.
- Compatibility — works on
@deepseek-ai/dsh0.1.5-rc.1+ (the0.1.5line from rc.1, the0.1.7line from rc.2), across the V3 (0.1.5-alpha.x+) and V4 (0.1.6/0.1.7+) session-log generations, from one shape-driven code path. The per-release matrix and how it is verified: docs/compatibility.md. - I18n — UI in English and 简体中文.
Like it?
If dsh-context helped you understand what your agent is carrying around, a ⭐ on GitHub is much appreciated — and issues/PRs are welcome!
License
Install
Install the catalog once, then DeepSeek Harness can find and install any plugin from this site automatically:
dsh plugin add dshbase-catalogThen say "install dsh-context for me" — your agent finds it in the directory and installs it. Docs: dshbase-catalog · verified packs.
Web profile:
dsh plugin --profile web add dsh-contextHeadless (CLI) profile:
dsh plugin --profile headless add dsh-contextPackage
npm: dsh-context · version — · tested on dsh 0.1.0-rc.6
Test report
Verified end-to-end: L1 install + L2 load + L3 runtime Q&A on dsh 0.1.0-rc.6.
When to use it
Give the agent a memory, a knowledge base, or a retrieval layer so it stops forgetting context between sessions.
Who it's for
Users running long projects who want the agent to remember decisions, docs, and preferences without re-explaining.
For developers — extending it
The memory/retrieval backend is the seam — plug a new store, tune what gets distilled, or add citation and audit trails.
- Suspicious permission (medium)
Share this badge
Drop this badge into your README — it links back here and updates automatically when our test status changes:

[](https://dshbase.com/plugins/dsh-context/)<a href="https://dshbase.com/plugins/dsh-context/"><img src="https://dshbase.com/badges/dsh-context.svg" alt="dshbase install-tested"></a>