
Plugin directory / Developer / dsh-metrics-panel
dsh-metrics-panel
Verified · install-tested on dsh bulai-z
What it does
`dsh-metrics-panel` 是面向 DeepSeek Harness 的**正式 Cordis 插件包**。它在 DSH 的 Web 界面中提供一个浮动监控面板,实时统计每一次大模型 API 调用的用量、缓存命中、费用与延迟,并提供概览曲线、请求明细、错误清单、模型/供应商/工具聚合,以及可配置的计费单价
Works — verified, early-stage project
`dsh-metrics-panel` 是面向 DeepSeek Harness 的**正式 Cordis 插件包**。它在 DSH 的 Web 界面中提供一个浮动监控面板,实时统计每一次大模型 API 调用的用量、缓存命中、费用与延迟,并提供概览曲线、请求明细、错误清单、模型/供应商/工具聚合,以及可配置的计费单价 It installs cleanly and boots without issues in our testing. It's early-stage but functional.
“Verified” means our automated CI actually ran dsh plugin add in a clean profile and it booted — nothing more. Feature descriptions and version compatibility are the author’s claims. This is not a security audit and not an endorsement of third-party code.
README
dsh-metrics-panel
DeepSeek Harness 用量监控面板 · AI Usage Monitor for DeepSeek Harness




实时统计 token 用量 · 缓存命中 · 费用 · 延迟吞吐 · 请求明细 的 DeepSeek Harness(DSH)插件。
简介
dsh-metrics-panel 是面向 DeepSeek Harness 的正式 Cordis 插件包。它在 DSH 的 Web 界面中提供一个浮动监控面板,实时统计每一次大模型 API 调用的用量、缓存命中、费用与延迟,并提供概览曲线、请求明细、错误清单、模型/供应商/工具聚合,以及可配置的计费单价。
💡 设计参考了
oh-my-pi的/stats页面,并按 DSH 的权威会话事件流重新实现。
功能特性
核心指标
- Token 用量:消耗总量、输入总量、输出量、推理量
- 缓存命中:命中 Token(
cacheReadTokens)、未命中 Token(未缓存输入 + 缓存写入) - 用量统计:对话轮数(
turn/start)、工具调用量(tool/call)、模型请求次数(step) - 每轮聚合:按
会话 | 轮次聚合每轮的输入 / 输出 / 缓存命中 - 请求明细:按
会话 | 轮次 | 步骤三元组去重合并的每次模型请求
十个界面分区
| 分区 | 说明 |
|---|---|
| 📊 概览 Overview | 统计卡片 + 费用/Token/请求量/按小时分布图表 |
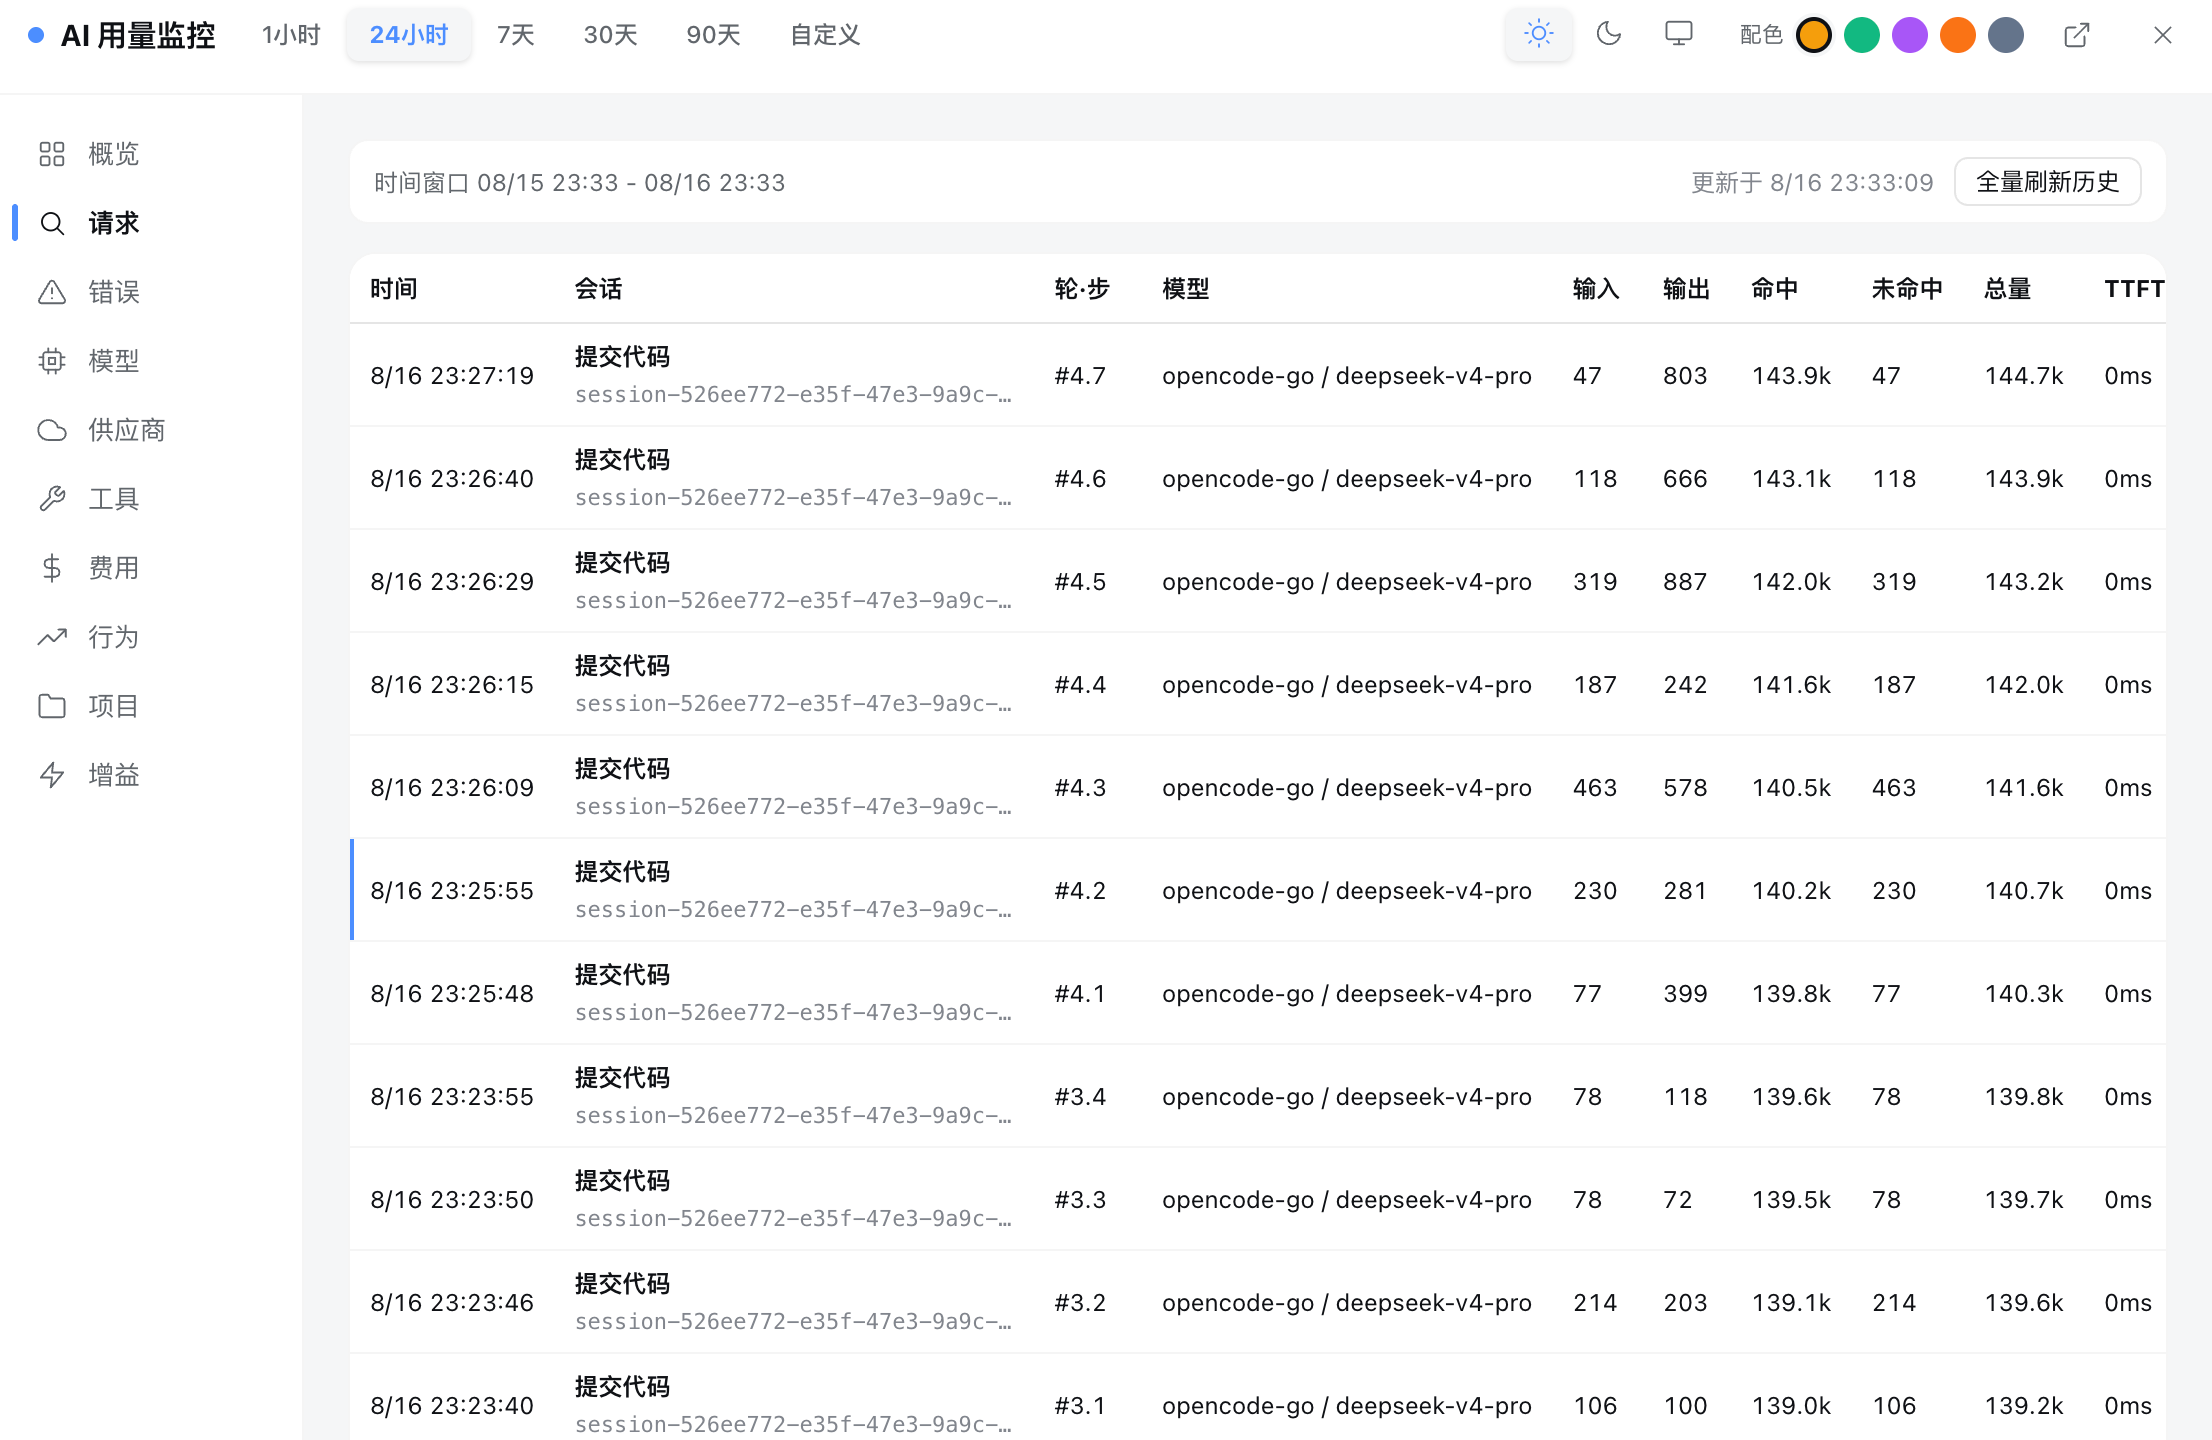
| 🔍 请求 Requests | 每次模型调用的分页明细列表(含会话归属与请求详情) |
| ⚠️ 错误 Errors | 错误请求清单与错误率 |
| 🤖 模型 Models | 按模型聚合的用量与费用 |
| ☁️ 供应商 Providers | 按供应商聚合的用量与费用 |
| 🔧 工具 Tools | 工具调用次数分布 |
| 💰 费用 Costs | 可配置的每百万 token 单价(缓存命中 / 未命中输入 / 输出三档) |
| 📈 行为 Behavior | 工具调用与供应商统计图 |
| 🗂️ 项目 Projects | 占位(需项目维度数据源,暂未实现) |
| ✨ 增益 Gain | 以缓存节省近似呈现 |
请求详情(Requests)
「请求」分区的每一行展示该请求所属的会话(标题 + 会话 id)。点击任意一行弹出完整详情:
- 服务接口:provider / model / 上下文窗口 / 采样参数(temperature / maxTokens / stop)
- 请求参数:系统提示词、工具清单、输入消息
- 返回参数:助手内容块、token 用量、推理内容
- 工具调用:工具名 + 参数
- HTTP 请求示例:完整请求行 + 请求 JSON + 响应 JSON(一键「复制 JSON」)
主题与配色
- 主题切换:浅色 / 深色 / 跟随系统,复用 DSH 官方 theme 服务,全局即时生效
- 面板配色:5 套图表主色(深寻蓝 / 翡翠绿 / 紫罗兰 / 暖阳橙 / 石墨灰),持久化到
localStorage
截图
面板位于 DSH 界面右下角(侧边栏底部也有「监控面板」入口),包含左侧分区导航、顶部时间范围 / 主题 / 配色控制与中央图表/表格区域。

安装
前置条件
- DeepSeek Harness CLI(
@deepseek-ai/dsh) pnpm
本插件是标准 DSH 插件包(npm 包 + Cordis 插件 + dsh.bundle 补丁层),通过 DSH 官方 dsh plugin 命令一键安装到 profile。
方式 1 · 从 GitHub 安装
# 把 <owner> 替换为你的 GitHub 用户名
dsh plugin --profile web add github:bulai-z/dsh-metrics-panel
方式 2 · 从本地安装(开发调试)
# 在插件源码目录内
dsh plugin --profile web add .
# 或绝对路径
dsh plugin --profile web add file:$PWD
dsh plugin会把add之后的参数原样转发给 profile 目录里的 pnpm,装完后自动「对账」:凡声明了dsh.bundle.patch的依赖会自动加入该 profile 的dsh.profile.bundles层组,无需手动改任何清单文件。若安装后提示
declares no dsh.bundle,说明package.json的dsh.bundle.patch声明缺失,安装虽成功但插件不会激活。
解决 command not found: dsh
# 1) 全局安装(推荐)
npm install -g @deepseek-ai/dsh

# 2) 用 npx 临时调用
npx @deepseek-ai/dsh web
使用
dsh web
打开页面后,侧边栏底部出现「监控面板」入口,点击即可开合面板。
面板操作
| 操作 | 说明 |
|---|---|
| 开合面板 | 点击侧边栏底部「监控面板」入口;面板右上角 ✕ 关闭 |
| 时间范围 | 顶部 1h / 24h / 7d / 30d / 90d,或「自定义」任意起止时间 |
| 全量刷新历史 | 枚举所有已持久化会话并回填事件日志,补齐未打开过的历史对话 |
| 主题 / 配色 | 顶部切换「浅色 / 深色 / 跟随系统」与 5 套面板配色 |
| 查看请求详情 | 「请求」分区点击任意行,查看服务接口 / 请求参数 / 返回参数 / 工具调用 / HTTP 示例 |
| 配置费用 | 「费用」分区设置三档单价与货币单位,点「保存单价」实时重算 |
计费配置
双时段计价(按厂商隔离)
三档单价(缓存命中 / 未命中输入 / 输出)各自拥有低峰(offpeak)与高峰(peak)两套价格。高峰时段按厂商隔离配置:每个厂商可有独立的高峰时段窗口(本地小时,含起点、不含终点,支持多段与跨零点,如 9–12、14–18),未单独配置的厂商继承全局默认高峰时段。
- 未启用双时段:所有请求按低峰价计费
- 启用后:落在厂商任一高峰时段的请求用高峰价,其余用低峰价
- 「费用统计」与「概览」的「总费用」会拆分展示高峰 / 低峰两部分
同模型、不同厂商独立定价
定价按三层回退:厂商模型价 → 模型通用价 → 默认价。
默认单价(DeepSeek 官网价)
| 模型 | 时段 | 缓存命中 | 未命中输入 | 输出 |
|---|---|---|---|---|
| deepseek-v4-flash(默认) | 空闲 | 0.05 | 1.5 | 4.5 |
| 高峰 | 0.10 | 3.0 | 9.0 | |
| deepseek-v4-pro | 空闲 | 0.15 | 4.5 | 13.5 |
| 高峰 | 0.30 | 9.0 | 27.0 |
(单位:元 / 每百万 token,取自 DeepSeek 官网)
工作原理
数据来源
数据从 DSH 的权威会话事件流 session/event 增量采集,并在插件激活时回填当前已存在会话。主要事件类型:
| 事件 | 用途 |
|---|---|
turn/start / turn/end |
对话轮数、每轮起止时间 |
session/title |
会话标题(请求面板展示所属会话) |
request/header / request/context |
provider / model 认知 + 请求参数(采样 / 系统提示 / 工具 / 上下文窗口) |
assistant/chunk / assistant/message |
token 用量(输入/输出/缓存命中/缓存写入/推理)+ 返回参数(助手内容块) |
tool/call / tool/result |
工具调用量、轨迹、请求内的工具调用明细 |
user/message |
用户输入 / 上下文注入(轨迹 + 请求参数) |
统计口径
- 输入总量 = 未缓存输入(
inputTokens)+ 缓存命中(cacheReadTokens)+ 缓存写入(cacheWriteTokens) - 未命中缓存 = 未缓存输入 + 缓存写入(即「计费意义上非命中的输入」)
- 消耗总量 = 输入总量 + 输出总量
- 费用按三档单价分别计算,单价为「每百万 token」的价格
- 缓存节省(cacheSavings) = 各请求
cacheReadTokens × (未命中输入价 − 缓存命中价)之和
采集与刷新
统计是增量采集 + 按需回填的,只会纳入插件「已经见过的会话」:
- 插件激活时:通过
sessions.list()回填当前已加载进内存的会话 - 运行中:监听
session/event与session/created(会话懒加载 / 从持久化重新进入时一次性回填全部历史事件) - 「全量刷新历史」:枚举所有已持久化会话并用
readFrom(id, 0)回填完整事件日志
回填按会话 id 的游标去重,幂等安全,重复点击不会重复计数。
⚠️ 数据为运行期内存态,插件停止或进程重启后清空。
关于「HTTP 请求示例」
会话事件流不含底层适配器的原始字节与真实 Authorization。请求详情里的「HTTP 请求示例」按已采集的 request/header(模型 / 采样 / 系统提示 / 工具)与派生的有序消息历史重建,端点按 provider 推断(如 deepseek → https://api.deepseek.com/chat/completions),Authorization 一律脱敏为 <redacted>,仅作调试参考。
架构
┌─────────────────────────────────────────────────┐
│  浏览器(Client 半 · lib/client.js)              │
│  React 界面 + 图表 + 主题/配色 + i18n            │
└───────────────┬─────────────────────────────────┘
                │ 同源 fetch /metrics/*
┌───────────────▼─────────────────────────────────┐
│  Node 进程(Host 半 · lib/index.js)             │
│  事件采集 + 统计聚合 + 费用配置 + 历史回填        │
│  经 ctx.webServer 注册 /metrics HTTP 路由        │
└───────────────┬─────────────────────────────────┘
                │ session/event 会话事件流
┌───────────────▼─────────────────────────────────┐
│  DeepSeek Harness 会话服务(sessions / 持久化)  │
└─────────────────────────────────────────────────┘
- Host 半(
lib/index.js):ESM 模块导出apply(ctx),注入webServer服务并注册/metrics路由,负责事件采集、统计聚合、请求详情、费用配置读写与历史回填 - Client 半(
lib/client.js):以window.__ModuleLoader__.load工厂形式打包的浏览器 bundle,经同源fetch调用 Host 的/metrics接口
作为独立安装包,本插件采用
ctx.webServerHTTP 路由(运行时可达的正式通道)——这是第三方包在不改动dsh-api-remotes白名单的前提下可行的 Host↔Client 通信方式。
HTTP 接口
| 接口 | 方法 | 说明 |
|---|---|---|
/metrics/dashboard |
GET | 全套聚合数据(按 ?range= 过滤) |
/metrics/request |
GET | 单次请求完整详情(?sessionId=&turn=&step=) |
/metrics/trace |
GET | 指定会话/轮次/步骤的轨迹事件 |
/metrics/pricing |
GET/POST | 读取 / 保存费用单价配置 |
/metrics/refresh |
POST | 全量刷新历史 |
/metrics/panel |
GET | 独立监控页(新标签页打开) |
目录结构
.
├── package.json         # 插件包清单:dsh.bundle.patch + dsh.client + peerDependencies + exports
├── cordis.patch.yml     # bundle 补丁层:声明插件入口(dsh plugin add 据此激活插件)
├── lib/
│   ├── index.js         # Host 端:事件采集 + 统计 + /metrics HTTP 接口(Node 进程)
│   └── client.js        # Client 端:界面 + 图表 + 费用 + 主题/配色(浏览器 bundle)
├── legacy/              # 早期「动态 Cordis 插件」形态的保留文件(仅作参考)
│   ├── host.js
│   └── client.js
├── CHANGELOG.md
├── CONTRIBUTING.md
├── LICENSE
└── README.md
legacy/目录是早期「动态插件」形态的保留文件;正式插件包已迁移到lib/index.js(ESM host)与lib/client.js(浏览器 bundle),通信由动态插件的harness.handle/host.call改为ctx.webServer注册的/metricsHTTP 接口。该目录不参与发布。
开发
# 安装依赖(peerDependencies)
pnpm install

# 本地安装到 DSH 的 web profile
dsh plugin --profile web add .

# 启动 DSH
dsh web
修改 Client 端(lib/client.js)后,需要 pnpm run dev:web 重建浏览器 bundle;修改 Host 端(lib/index.js)后需重启 dsh web 使插件重新加载。
容量上限
明细数组有容量上限(请求 / 轮次 / 工具各 5000 条,轨迹 8000 条),超出后丢弃最早记录。
FAQ
Q:为什么打开过哪些对话,它们的历史才会被统计?
A:插件采用增量采集 + 按需回填。可以点「全量刷新历史」一次性补齐所有已持久化会话,无需逐个打开。
Q:HTTP 请求示例是真实的请求吗?
A:不是字节级真实请求。会话事件流不含底层适配器的原始字节与 Authorization,该示例为按 request/header 与派生消息历史重建的参考,端点按 provider 推断、鉴权头已脱敏。
Q:数据会持久化吗?
A:不会。数据是运行期内存态,插件停止或进程重启后清空。
Q:支持哪些模型 / 厂商?
A:不绑定特定厂商,按会话事件流中的 provider / model 自动聚合。默认内置了 DeepSeek 官网价格,可在「费用」页为任意厂商 / 模型配置单价。
贡献
欢迎提交 Issue 与 Pull Request!请先阅读 CONTRIBUTING.md。
许可证
MIT © 2026 dsh-metrics-panel contributors
致谢
- 功能设计参考
oh-my-pi的/stats页面 - 数据口径基于 DeepSeek Harness 的会话事件流
Install
Install the catalog once, then DeepSeek Harness can find and install any plugin from this site automatically:
dsh plugin add dshbase-catalogThen say "install dsh-metrics-panel for me" — your agent finds it in the directory and installs it. Docs: dshbase-catalog · verified packs.
This plugin is GitHub source (not published to npm) — install it straight from the repo:
Web profile:
dsh plugin --profile web add github:bulai-z/dsh-metrics-panelHeadless (CLI) profile:
dsh plugin --profile headless add github:bulai-z/dsh-metrics-panelTest report
Verified: L1 install + L2 load + L3 runtime from GitHub source on dsh 0.1.0-rc.6.
Share this badge
Drop this badge into your README — it links back here and updates automatically when our test status changes:

[](https://dshbase.com/plugins/dsh-metrics-panel/)<a href="https://dshbase.com/plugins/dsh-metrics-panel/"><img src="https://dshbase.com/badges/dsh-metrics-panel.svg" alt="dshbase install-tested"></a>