
插件目录 / Network / dsh-usage-chart
dsh-usage-chart
已验证 · 实测可装 Max-Samson
功能简介
实时 Token 用量、成本估算与余额插件
可用 — 实测通过,早期项目
实时 Token 用量、成本估算与余额插件 实测能干净安装、正常启动。早期项目,但功能可用。
「已验证」表示我们的自动化 CI 在干净 profile 里实际执行了 dsh plugin add 并启动成功——仅此而已。功能描述与版本兼容性均为作者声明。这不是安全审计,也不代表对第三方代码的背书。
README
dsh-usage-chart
A usage, cost, and account-balance dashboard for DeepSeek Harness Web.


简体中文 · Report an issue · Changelog (EN) · 更新日志(中文)
Interface preview: light English on the left and dark Simplified Chinese on the right. Both variants follow the DSH theme and in-app language setting.
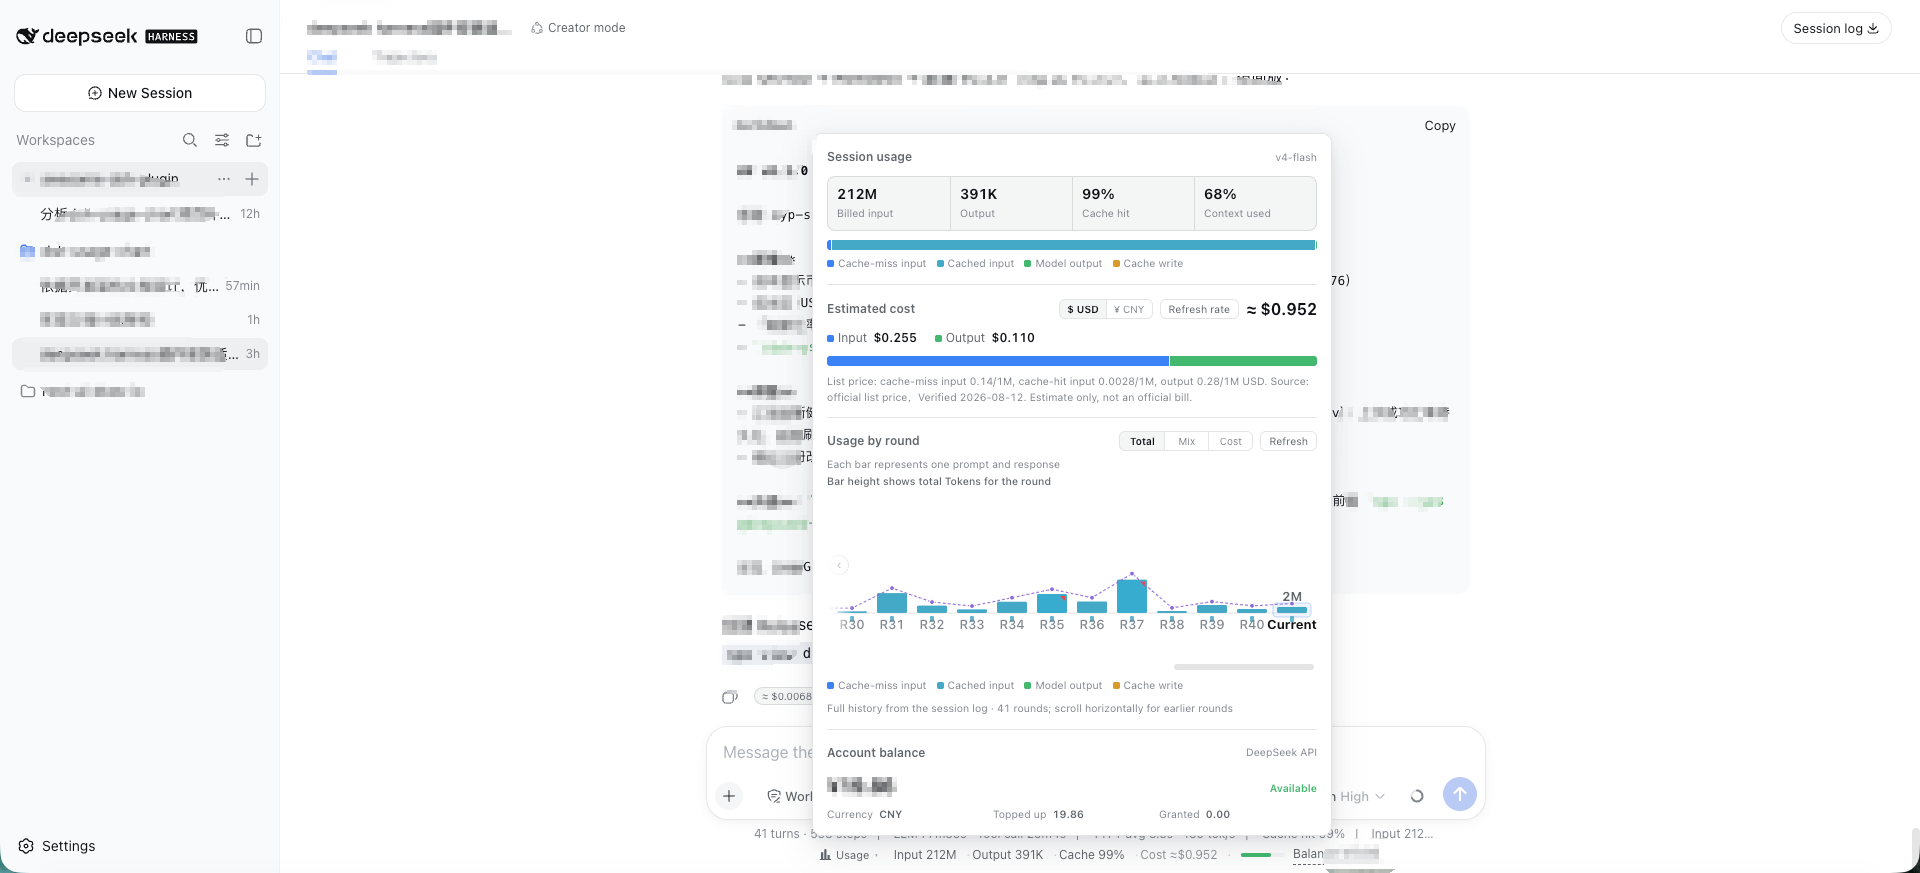 Light theme · English |
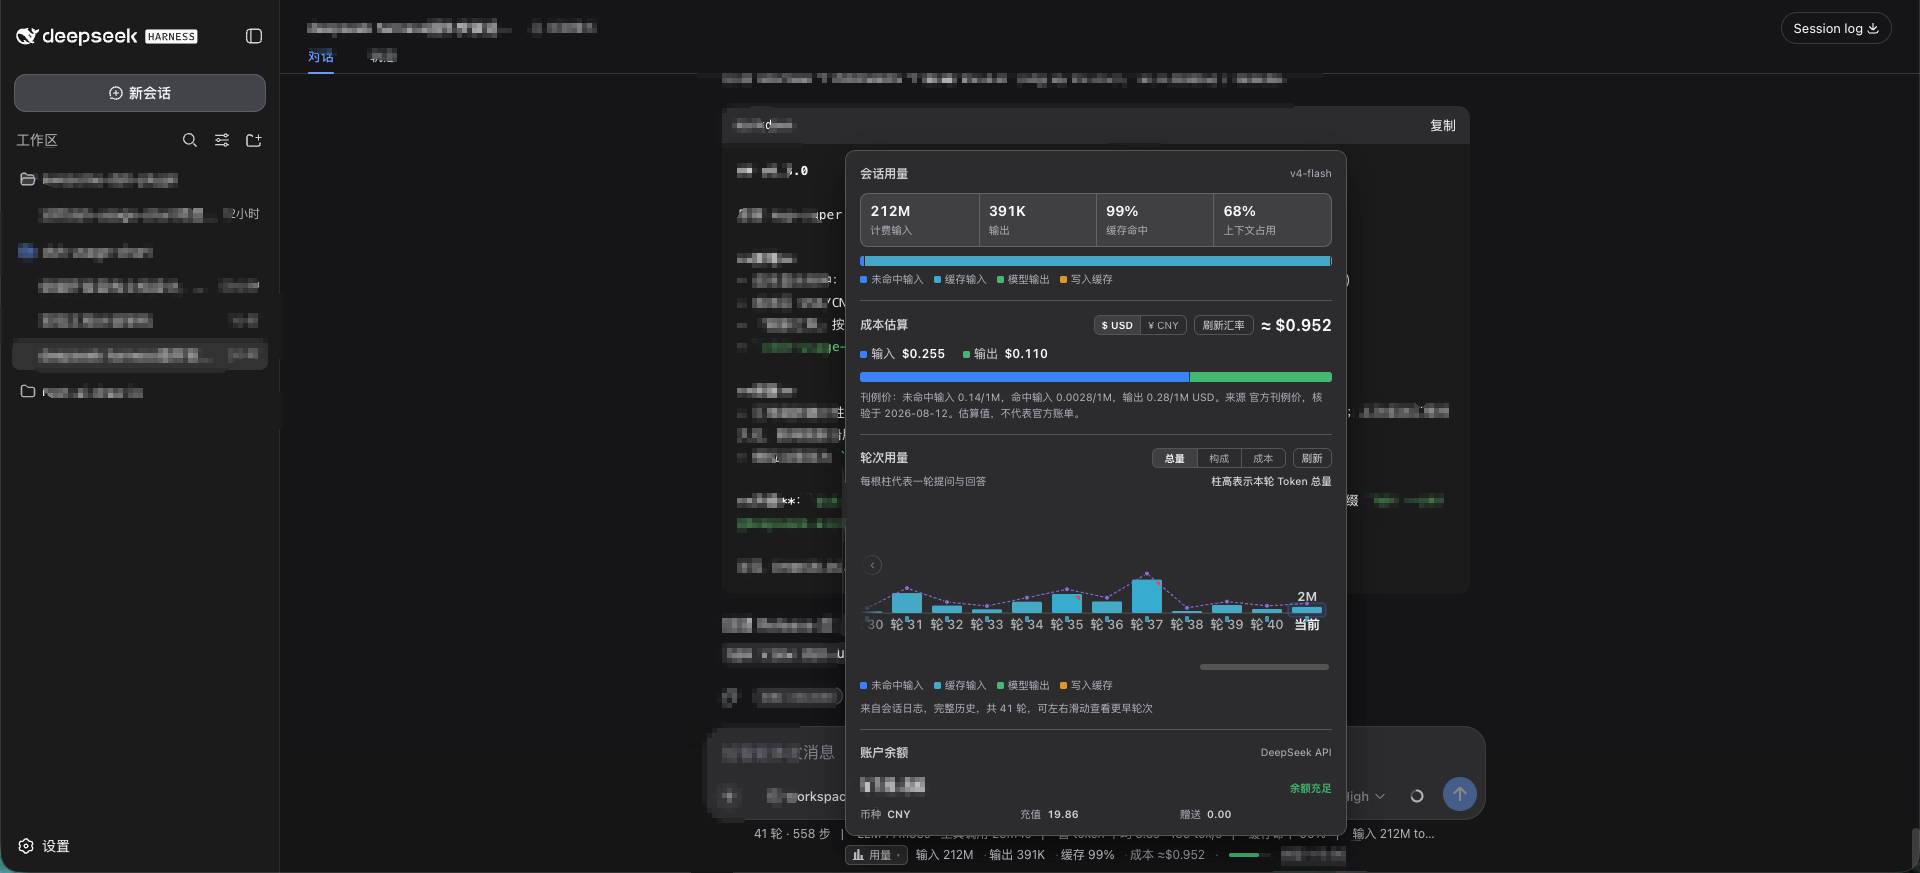 Dark theme · 简体中文 |
Both screenshots use fictional demo data only. They contain no real session content, token counts, costs, balances, or API keys.
The plugin adds a compact indicator below the conversation composer. It shows input/output tokens, cache-hit ratio, estimated cost, active model, a multi-segment context-pressure bar (system/tools/messages breakdown, v1.1.0), and DeepSeek account balance. Click it to open a zero-dependency SVG dashboard with per-turn usage history — including a cost view (every bar shows its own cost value, not just the current round), a duration overlay, anomaly markers, an explainer tooltip (tokens + cost + model + billing tier + duration/TTFT/TPS + user input source attribution: human/agent/continuation, v1.1.0 + end reason), horizontally scrollable per-round bars (all rounds, fixed slim bar width, auto-scroll to latest), a dedicated Context & Compaction Diagnostics section (system/tools/messages token composition, compaction timeline, freed tokens, summarize cost, context occupancy suggestions, v1.1.0), a dismissible ≈ ¥/$0.00xx badge on each assistant message, peak/off-peak tiered billing with a live red/green billing-tier tag in the panel (red = peak, green = off-peak, v1.0.1), and official dual-currency pricing (CNY from the Chinese pricing page, USD from the English pricing page — no FX conversion, v1.0.1).
▸ Input 12.4M · Output 86.2K · Hit 72% · Cost ≈$0.042 / ≈¥0.284 · demo-model · Balance --
Click ▸ to open the dashboard panel:
- Session usage summary — Input (uncached/cached), output, cache-hit percentage, and context occupancy (derived from official adapter
tokenUsage/contextPressureprojections). - Context breakdown & compaction diagnostics (v1.1.0) — Official
contextBreakdownprojection breakdown (System prompt / Tools schema / Message history token counts and percentage with a 3-segment color bar, annotated as heuristic approximations); Host foldscompaction/*events (which round was compacted, how many tokens were freed, model used, and summarize call cost); provides proactive suggestions (≥75% / ≥90% occupancy) to start a new session or reduce large file injections. - Cost estimation — Estimated from official list prices (CNY/USD dual-currency per 1M tokens, peak/off-peak tiers) with verified source date; supports user override via
pricing.json; unpriced models are explicitly tagged. - Peak / off-peak tiered billing (v1.0.1) — Peak hours (Beijing time Monday–Friday 09:00–12:00 and 14:00–18:00, UTC 01:00–04:00 and 06:00–10:00) billed at 2× the off-peak rate; all other hours and weekends billed at off-peak rates; rounds bill automatically based on start time (or conservative peak if unknown); live red/green tag in the panel header.
- Official dual-currency list pricing (v1.0.1) — Builtin official CNY and USD prices directly used according to the active display currency — no FX conversion applied to costs (matching official billing); "Refresh rate" updates only the informational "1 USD ≈ X CNY" reference note.
- Multi-currency display (v0.3 / v1.0.1) — One-click toggle between USD and CNY (persisted in localStorage); indicator, panel, chart, and badges all follow.
- Per-round usage & source attribution (v1.1.0) — "Total / Composition / Cost" view modes; cost mode shows each bar's monetary amount; duration line overlay; anomaly marker chips on cost spikes; cache hit miniature ticks; hover explainer card with full round metrics + user input source attribution: human/agent/continuation; horizontal scroll for full session history.
- Cost badge — Dismissible
≈ ¥/$0.00xxbadge rendered at the bottom of each assistant message. - Multi-segment context pressure bar (v1.1.0) — Slim bar in the composer dock indicating total context occupancy from green to red, segmented by System (blue), Tools (amber), and Messages (green) with hover percentages.
- Account balance — Real-time balance queried via official DeepSeek API (proxied securely through Host, API key never exposed to browser).
- Bilingual (ZH / EN) — Automatically follows DSH in-app language setting, with runtime switching between
zhanden.
Data sources
| Metric | Source | Accuracy |
|---|---|---|
| Token usage | DSH official adapter session projections (tokenUsage / contextPressure) |
✅ Official real-time data |
| Cost | Official list price (builtin + optional pricing.json override, CNY/USD dual-currency / 1M tokens, peak/off-peak tiers) × reported usage |
⚠️ Estimate, not invoice; resolved via Host /pricing snapshot |
| Display currency | Host /meta config; costs directly calculated in selected currency list price |
✅ Official dual-currency list price |
| Per-round history | Host session log fold (/usage): duration / TTFT / TPS / model attribution / input source attribution / end reason / per-round cost |
✅ Official event stream fold |
| Context & compaction | Official contextBreakdown / contextPressure projections + Host compaction/* event fold |
✅ Official projections + event fold |
| Balance | Official GET https://api.deepseek.com/user/balance |
✅ Official real-time data |
| Model name | Adapter request provenance / request/context |
✅ Official real-time data |
Tech stack
- Language: TypeScript source, compiled to DSH loadable JavaScript bundles
- Framework: Cordis plugin model + React 18
- Build: esbuild (Host half = Node ESM; Client half = browser factory bundle matching DSH Web
PLATFORM_MODULES) - Visualization: Zero-dependency handcrafted SVG (matches platform rendering, minimal footprint, ultra-stable)
Install
Prerequisites: DeepSeek Harness ≥ 0.1.0-rc.6 · Node.js ≥ 20 · pnpm on PATH (dsh plugin forwards installs to pnpm).
If you get
dsh: command not found(or PowerShellThe term 'dsh' is not recognized…),
you rannpx @deepseek-ai/dshtransiently — see FAQ item 1 (install globally, or prefix commands withnpx --yes @deepseek-ai/dsh).
Option 1: npm registry (recommended, prebuilt — no build tooling needed)
dsh plugin --profile web add dsh-usage-chart   # installs and registers the profile plugin layer
dsh web --profile web                          # starts DSH Web (stop it first if already running)
To update (upgrade to a new version): pnpm may print Already up to date when already installed — use an explicit version (recommended) or remove then re-add:
# Option ①: pin the target version explicitly
dsh plugin --profile web add [email protected]
# Option ②: remove, then re-add (back to latest)
dsh plugin --profile web remove dsh-usage-chart
dsh plugin --profile web add dsh-usage-chart
Then restart DSH Web.
⚠️ Restarting the
dsh webprocess is required after any upgrade. The Host caches plugin code in memory (no hot reload): new routes (e.g./pricing,/meta,/rate) are only served after a restart. See the Changelog.
Option 2: install from GitHub (source build)
dsh plugin --profile web add github:Max-Samson/dsh-usage-chart#<commit-sha>
Git installs run the package prepare script (node build.mjs) to build from source. pnpm ≥ 10 blocks prepare scripts by default — allow this package in the profile's pnpm-workspace.yaml, then re-run:
allowBuilds:
  dsh-usage-chart: true
Option 3: local directory (development)
git clone https://github.com/Max-Samson/dsh-usage-chart.git
cd dsh-usage-chart
npm ci && npm run build
dsh plugin --profile web add "$PWD"   # links the current checkout
dsh web --profile web
Verify the install
The composed profile should contain the plugin row:
dsh --profile web --dump-config | grep -A4 'id: dsh-usage-chart'Open DSH Web and enter any existing session: the "Usage" indicator (tokens / cost / model) appears below the composer, with the account balance on the right; click ▸ to open the dashboard.
Balance query configuration
The balance query needs a DeepSeek API key, resolved per request in this order (no restart needed):
- DSH Web settings (recommended, requires plugin ≥ 0.1.1): configure the DeepSeek API key under Settings → Models. The plugin reads the same key through the DSH credentials service (
.credentials.yamluser layer); no extra setup is required. - Environment variable:
DEEPSEEK_API_KEY=sk-...before startingdsh web(the credentials service'senvlayer resolves it the same way). - Plugin config: override
config.apiKeyin the profile'scordis.patch.yml(stored in plain text on disk — only recommended for a protected local profile):
- insert:
    - id: dsh-usage-chart
      name: dsh-usage-chart
      config:
        apiKey: 'sk-...'        # empty falls back to web settings / env variable
        baseUrl: 'https://api.deepseek.com'
        # pricingFile: '/path/to/pricing.json'   # optional: price override file
        # currency: 'cny'        # optional (v0.3): 'usd' (default) | 'cny'
        # cnyPerUsd: 6.76        # optional (v0.3): FX rate for note display
        # fxUrl: 'https://open.er-api.com/v6/latest/USD'   # optional (v0.3): custom live rate source
The key stays in the Host process and is never sent to the browser.
Price overrides (optional, v0.2+ / v1.0.1 dual-currency, tiered)
Costs are resolved with priority user override file > builtin list price > fallback estimate (prices are resolved only on the Host; the client consumes the /dsh-usage-chart/pricing snapshot — a single source of truth, ADR 2). The default override file is $DSH_HOME/data/dsh-usage-chart/pricing.json (or ~/.dsh/... without DSH_HOME); both flat and { "models": { … } } shapes are accepted and changes are picked up live:
{
  "deepseek-v4-flash": {
    "offPeak": {
      "cny": { "cacheMissInput": 1.5, "cacheHitInput": 0.05, "output": 4.5 },
      "usd": { "cacheMissInput": 0.22, "cacheHitInput": 0.007, "output": 0.66 }
    },
    "peak": {
      "cny": { "cacheMissInput": 3.0, "cacheHitInput": 0.10, "output": 9.0 },
      "usd": { "cacheMissInput": 0.44, "cacheHitInput": 0.014, "output": 1.32 }
    },
    "verifiedAt": 1755100800000
  }
}
Unit prices are dual-currency (CNY + USD) per 1M tokens: peak covers peak hours (Beijing time Monday–Friday 09:00–12:00 and 14:00–18:00, charged at 2×), offPeak covers the rest (including weekends). Unpriced models are explicitly marked "Unpriced model" in the UI.
Display currency and live FX rate (v0.3+ / v1.0.1 official dual-currency)
Costs are computed with the official list price of the selected currency (CNY quote from the Chinese pricing page, USD quote from the English pricing page — no FX conversion, consistent with the official bill). The cost section has a one-click CNY/USD toggle (remembered in the browser); the indicator, panel, chart and badge all follow it. config.cnyPerUsd (default 6.76) and the "Refresh rate" button (via Host /dsh-usage-chart/rate proxy) are used only for the informational "1 USD ≈ X CNY" note:
- Multi-source fallback: when the custom source (
config.fxUrl) is unreachable, a built-in fallback source (frankfurter.dev) is tried; - Offline resilience: the last successful rate is persisted, so a refresh while offline keeps the last real rate instead of the fixed default;
- Config distribution: the Host
/dsh-usage-chart/metaroute sends the display currency and rate config to the client.
Uninstall
dsh plugin --profile web remove dsh-usage-chart   # removes the dependency and de-registers the layer
dsh web --profile web                             # restart; indicator and panel disappear
remove also cleans the package out of node_modules and dsh.profile.bundles (no leftovers).
FAQ
Q: dsh is not found (command not found / PowerShell The term 'dsh' is not recognized)?
A: npx @deepseek-ai/dsh runs transiently and installs no global command. Run npm install -g @deepseek-ai/dsh and open a new terminal, or prefix commands with npx --yes @deepseek-ai/dsh .... Missing pnpm is the same: npm install -g pnpm.
Q: Install shows WARN missing peer react@^18.2.0?
A: Harmless — react is provided by the DSH Web platform in the browser; the profile does not need it. Plugin ≥ 0.1.1 marks react as an optional peer.
Q: The balance still shows – / "not configured" after setting the API key in the web UI?
A: Make sure the plugin is ≥ 0.1.1, then restart dsh web. As a stopgap, set DEEPSEEK_API_KEY or config.apiKey.
Q: add reports dsh-usage-chart is not in the npm registry?
A: Use "Option 3: local directory" to test, or wait for the maintainer to publish.
Development
git clone https://github.com/Max-Samson/dsh-usage-chart.git
cd dsh-usage-chart
npm ci
npm run verify       # typecheck + build + node:test
npm pack --dry-run   # check package tarball
Visual probe scripts (optional)
scripts/ provides playwright-core based probes targeting a running DSH Web instance (http://127.0.0.1:3080 by default):
| Variable | Default | Purpose |
|---|---|---|
DSH_PROBE_URL |
http://127.0.0.1:3080 |
Target DSH Web URL |
DSH_PROBE_CHROME |
Platform default | Path to Chrome/Chromium executable |
DSH_PROBE_SESSION |
Builtin list | Target session title fragment |
DSH_PROBE_ARTIFACTS |
<repo>/artifacts |
Screenshot output directory |
node scripts/shot.mjs          # Take collapsed/expanded screenshots
node scripts/probe-panel.mjs   # Test panel container clipping
node scripts/probe-popover.mjs # Test popover bounds and toggle
node scripts/verify-render.mjs # Full render verification (light/dark themes, ZH/EN)
Maintainer releases
For the first release, complete npm account verification and run npm publish --access public locally. Once the package exists on npm, configure Trusted Publishing for this repository. Subsequent GitHub Releases publish new versions through the workflow.
- Ensure
package.jsonandCHANGELOG.mdversions match and runnpm run verify. - Create
v<version>GitHub Release. release.ymlpublishes the prebuilt package via npm Trusted Publishing with provenance.
Plugin architecture
dsh-usage-chart/
├── package.json          # dsh.bundle (install layer) + dsh.client (browser half) + exports["./client"]
├── cordis.patch.yml      # Plugin insertion config (config.apiKey / baseUrl / pricingFile / currency…)
├── build.mjs             # esbuild dual outputs (+ client pure test bundle) + tsc type defs (lib/types)
├── src/
│   ├── index.ts          # Host half: /balance proxy + /usage round fold + /pricing snapshot
│   │                     #          + /meta currency config + /rate live FX proxy
│   ├── pricing/
│   │   ├── calc.ts       # Pure shared pricing math (dual-currency, peak/off-peak)
│   │   ├── source.ts     # PricingSource seam: builtin list prices + pricing.json file adapter
│   │   └── resolve.ts    # PricingResolver: user file > builtin > fallback
│   ├── usage/
│   │   ├── rounds.ts     # RoundFold: duration/TTFT/TPS/model/source attribution/end reason/cost
│   │   └── compactions.ts # CompactionFold: compaction range/freed tokens/summarize dual-currency cost
│   └── client/
│       ├── index.ts      # Client entry: registers composer.dock + assistant-actions slots
│       ├── UsageIndicator.tsx  # Dock indicator line (with 3-segment colored pressure bar)
│       ├── UsagePanel.tsx      # Visual dashboard panel composition root
│       ├── charts.tsx          # Zero-dependency SVG/HTML primitives (bars / legends)
│       ├── chart/RoundBars.tsx # Deep module round bar chart (3 modes + duration line + anomaly chip + source)
│       ├── rounds/             # observed.ts / history.ts / types.ts
│       ├── diagnose/
│       │   ├── anomaly.ts      # Cost anomaly detector (shared pure module)
│       │   └── context.ts      # ContextReport: breakdown / compaction stats / suggestions
│       ├── badge/CostBadge.tsx # Assistant message cost badge
│       ├── pricing-api.ts      # usePricing: /pricing snapshot consumer
│       ├── currency.ts         # Currency store (/meta config + switch + /rate refresh)
│       ├── balance.ts          # Balance query hook (proxied through Host)
│       └── styles.ts           # Injected CSS (<style data-plugin>)
└── types/                # Vendored minimal type declarations
Data and security boundaries
- Token and context data come from the active DSH session projections; per-round chart reads the session log and falls back to page-observed deltas if unavailable.
- Costs are estimated based on official list prices (user-overridable via
pricing.json); price resolution happens only on the Host. - Currency and rates:
/metadelivers display config;/rateproxies live FX rates via the Host (browser never directly contacts external rate providers); rate URLs require HTTPS (loopback HTTP allowed for local testing). - Balance is queried via the same-origin Host proxy (direct browser requests have CORS and key-exposure risks).
- Host routes only accept same-origin GET requests and set
no-storeon JSON responses; the plugin never sends the API key to the browser.
Compatibility
| Component | Supported |
|---|---|
| DSH | ≥ 0.1.0-rc.6, built against the 0.1.x API |
| Node.js | ≥ 20 |
| Web UI | React 18 / conversation.composer.dock + conversation.chat.assistant-actions |
| OS | macOS, Linux, Windows (pure JavaScript, no native dependencies) |
Community and open source
License
MIT
安装
装一次目录插件,之后本站所有插件都能让 DeepSeek Harness 自动找、自动装:
dsh plugin add dshbase-catalog然后对 agent 说「帮我装 dsh-usage-chart」,它会在目录里找到并自动安装。文档:dshbase-catalog · 已验证场景包。
Web profile:
dsh plugin --profile web add dsh-usage-chartHeadless(CLI)profile:
dsh plugin --profile headless add dsh-usage-chart包信息
npm:dsh-usage-chart · 版本 0.1.1 · 实测环境 dsh 0.1.0-rc.6
实测报告
端到端验证通过:dsh 0.1.0-rc.6 上 L1 安装 + L2 加载 + L3 运行问答。
使用场景
给 agent 网络能力——请求、API、代理或协议——让它能触达外部系统。
适合谁
任务涉及网络的人——调 API、抓资源或与远端服务通信。
二次开发建议
适配器和请求整形是缝——加协议、鉴权处理器、重试和端点抽象。
分享徽章
把这枚徽章粘进 README——它会链回本页,实测状态变化时自动更新:

[](https://dshbase.com/zh/plugins/dsh-usage-chart/)<a href="https://dshbase.com/zh/plugins/dsh-usage-chart/"><img src="https://dshbase.com/badges/dsh-usage-chart.svg" alt="dshbase 实测可装"></a>