
Plugin directory / Developer / dsh-token-dashboard
dsh-token-dashboard
Verified · install-tested on dsh apodemakeles
What it does
DeepSeek Harness (DSH) plugin: local daily/weekly token usage dashboard and heatmap
Works — verified, early-stage project
DeepSeek Harness (DSH) plugin: local daily/weekly token usage dashboard and heatmap It installs cleanly and boots without issues in our testing. It's early-stage but functional.
“Verified” means our automated CI actually ran dsh plugin add in a clean profile and it booted — nothing more. Feature descriptions and version compatibility are the author’s claims. This is not a security audit and not an endorsement of third-party code.
README
@apodemakeles/dsh-token-dashboard
English | 中文
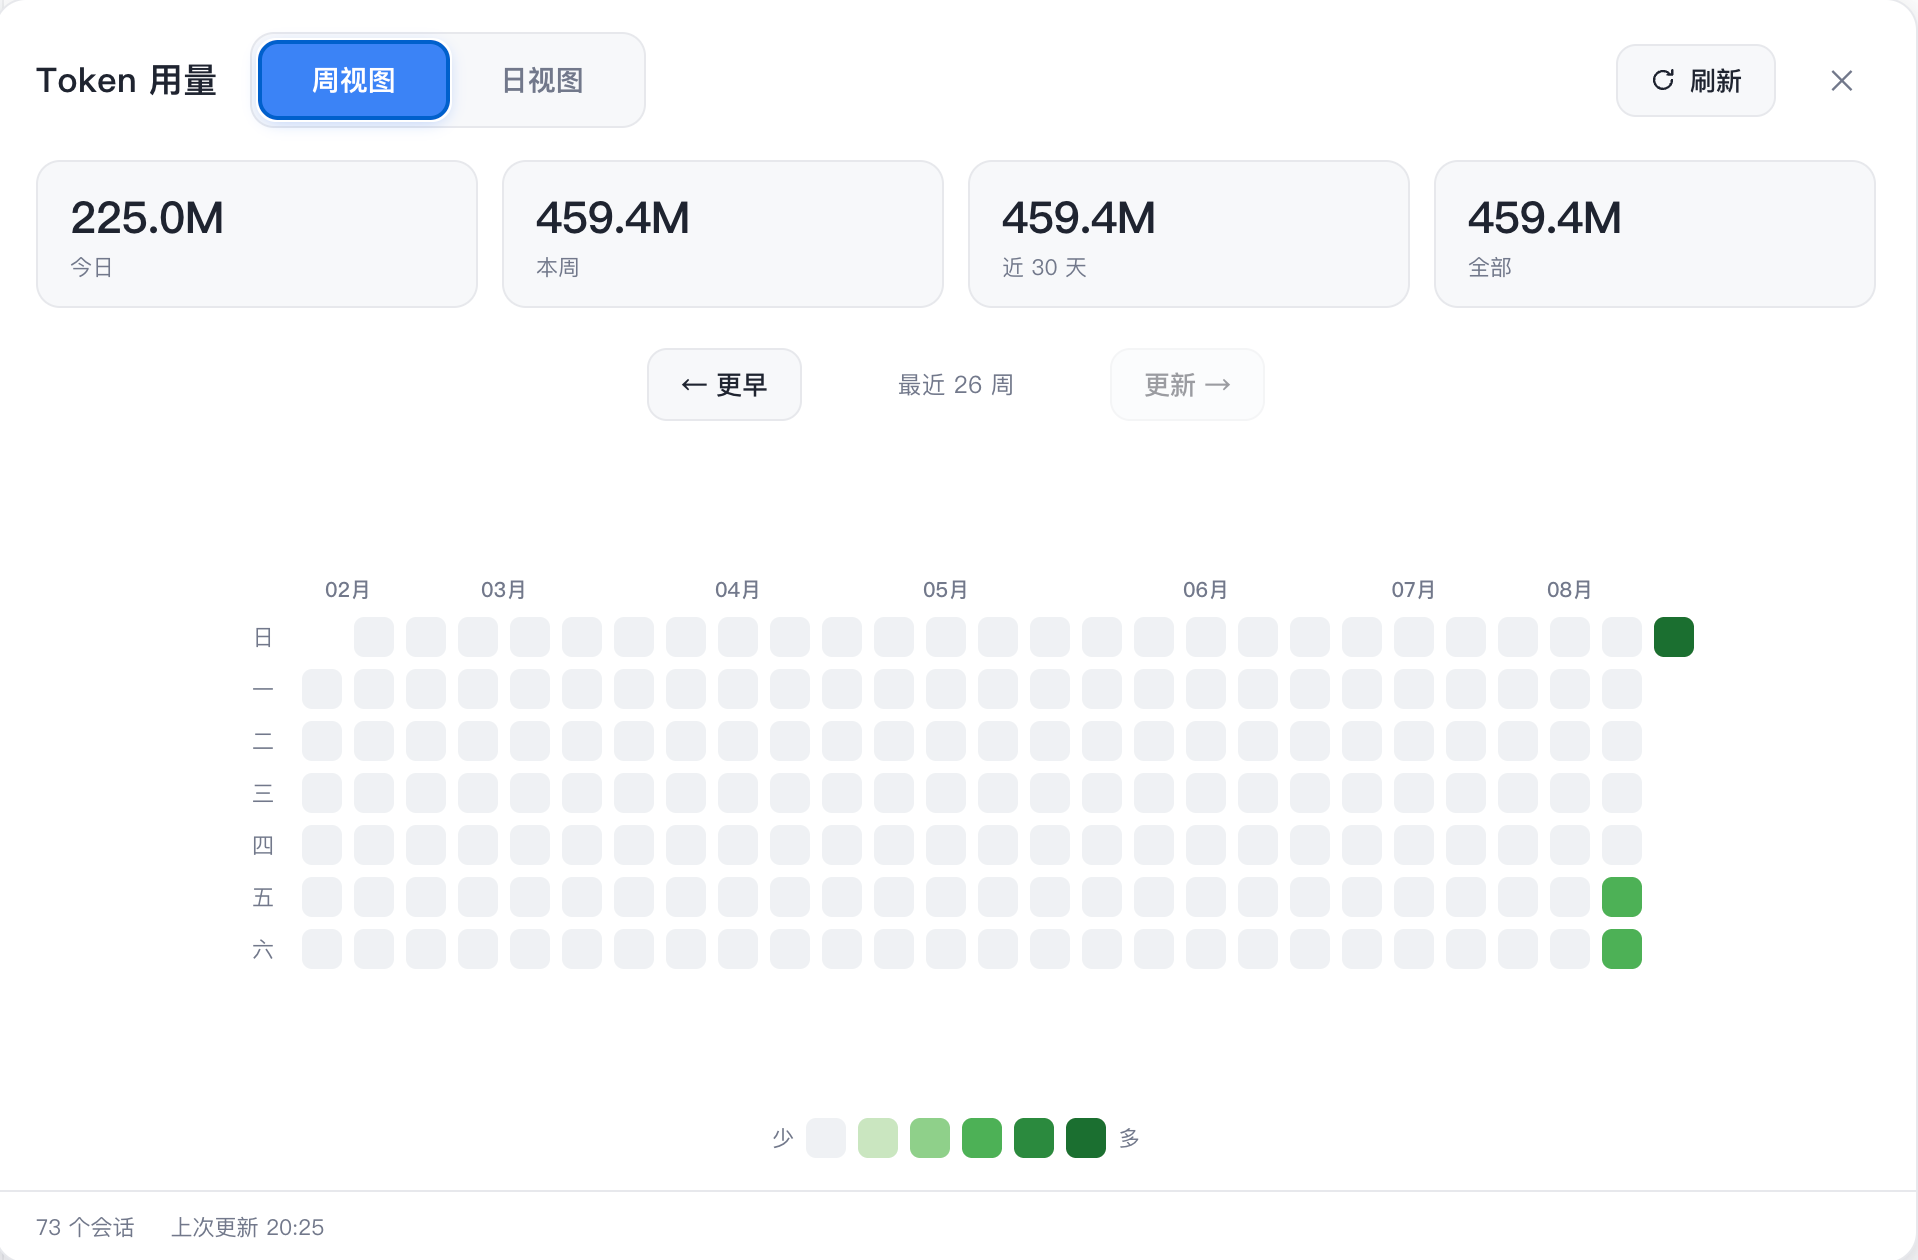
A DeepSeek Harness (DSH) web GUI plugin: a token-consumption heatmap panel. It shows your total token usage per day / per week across all projects on this machine, GitHub-contributions style. Usage facts are projected into a local SQLite database by a persistent Worker, so opening the panel never scans session logs.
Status: released v0.2.0 — GitHub distribution is live. The package is not currently published to npm.
Screenshots
Weekly heatmap
Daily view

What it does
- Host half — listens to live
session/event, flushes through DSH's durability barrier, and sends minimal usage deltas to a persistent Worker. The Worker owns SQLite (node:sqlite), commits facts/checkpoints atomically, and serves one consistent snapshot endpoint. - Client half — registers a Token entry in the sidebar and opens a dedicated panel rendering the heatmap (weekly grid + daily view). It fetches a single
GET /api/token-dashboard/snapshotper open/refresh/page change. - CLI —
dsh-token-dashboard status|verify|rebuild|backups|restore|cleanupfor local maintenance.
Installation
From GitHub:
dsh plugin --profile web add github:apodemakeles/dsh-token-dashboard
Then restart dsh web. Open any project session and click the Token entry in the sidebar.
The npm package is not currently published; use the GitHub installation above.
Data and operations
- Projection database:
$DSH_HOME/data/token-dashboard/usage-v1.sqlite(default~/.dsh). - Total tokens =
inputTokens + outputTokens + cacheReadTokens(cache reads count into the headline). - The panel only calls the snapshot route; it does not trigger
listSnapshots,inspect,readFrom,flush, or backfill. - First startup initializes the database in the background; the panel shows phase/progress until
ready.
Development
git clone https://github.com/apodemakeles/dsh-token-dashboard.git
cd dsh-token-dashboard
pnpm install && pnpm build
dsh plugin --profile web add link:$(pwd)
See .scratch/dsh-token-dashboard/map.md for the project map (planning tracker), docs/durable-usage-architecture.md for the architecture contract, and docs/dev-loop.md for the full dev loop.
Known limitations
- Projection is machine-local: it reads sessions stored on this machine (
~/.dsh/sessionsis the authority; SQLite is a rebuildable projection). - Host/Worker changes require restarting DSH; client HMR does not cover the persistent Worker.
- SQLite is experimental in Node 24 (
node:sqlite); the plugin checks capability at startup and does not hide the warning globally.
License
MIT
Install
Install the catalog once, then DeepSeek Harness can find and install any plugin from this site automatically:
dsh plugin add dshbase-catalogThen say "install dsh-token-dashboard for me" — your agent finds it in the directory and installs it. Docs: dshbase-catalog · verified packs.
This plugin is GitHub source (not published to npm) — install it straight from the repo:
Web profile:
dsh plugin --profile web add github:apodemakeles/dsh-token-dashboardHeadless (CLI) profile:
dsh plugin --profile headless add github:apodemakeles/dsh-token-dashboardTest report
Verified: L1 install + L2 load + L3 runtime from GitHub source on dsh 0.1.0-rc.6.
Share this badge
Drop this badge into your README — it links back here and updates automatically when our test status changes:

[](https://dshbase.com/plugins/dsh-token-dashboard/)<a href="https://dshbase.com/plugins/dsh-token-dashboard/"><img src="https://dshbase.com/badges/dsh-token-dashboard.svg" alt="dshbase install-tested"></a>